Europe - UNEP
Europe - UNEP
Europe - UNEP

Create successful ePaper yourself
Turn your PDF publications into a flip-book with our unique Google optimized e-Paper software.
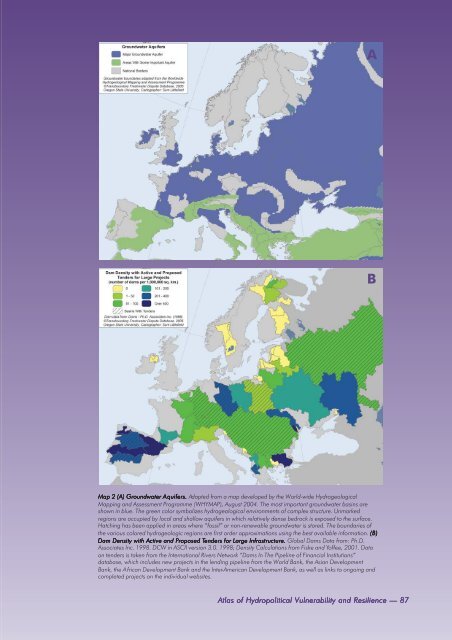
A<br />
B<br />
Map 2 (A) Groundwater Aquifers.<br />
Adapted from a map developed by the World-wide Hydrogeological<br />
Mapping and Assessment Programme (WHYMAP), August 2004. The most important groundwater basins are<br />
shown in blue. The green color symbolizes hydrogeological environments of complex structure. Unmarked<br />
regions are occupied by local and shallow aquifers in which relatively dense bedrock is exposed to the surface.<br />
Hatching has been applied in areas where “fossil” or non-renewable groundwater is stored. The boundaries of<br />
the various colored hydrogeologic regions are first order approximations using the best available information. (B)<br />
Dam Density with Active and Proposed Tenders for Large Infrastructure. Global Dams Data from: Ph.D.<br />
Associates Inc. 1998. DCW in ASCII version 3.0. 1998; Density Calculations from Fiske and Yoffee, 2001. Data<br />
on tenders is taken from the International Rivers Network “Dams In The Pipeline of Financial Institutions”<br />
database, which includes new projects in the lending pipeline from the World Bank, the Asian Development<br />
Bank, the A frican Development Bank and the Inter-American Development Bank, as well as links to ongoing and<br />
completed projects on the individual websites.<br />
Atlas of Hydropolitical Vulnerability and Resilience — 87