- Page 1 and 2: Fighting the Diseases of Poverty Ed
- Page 3 and 4: About International Policy Network
- Page 5 and 6: Fighting the Diseases of Poverty Ed
- Page 8 and 9: The authors Johan Biermann is a pla
- Page 10: The authors ix Maureen has publishe
- Page 13 and 14: xii Fighting the Diseases of Povert
- Page 15 and 16: xiv Fighting the Diseases of Povert
- Page 17 and 18: xvi Fighting the Diseases of Povert
- Page 19 and 20: xviii Fighting the Diseases of Pove
- Page 21 and 22: xx Fighting the Diseases of Poverty
- Page 23 and 24: xxii Fighting the Diseases of Pover
- Page 25 and 26: xxiv Fighting the Diseases of Pover
- Page 27 and 28: xxvi Fighting the Diseases of Pover
- Page 29 and 30: xxviii Fighting the Diseases of Pov
- Page 31 and 32: 2 Fighting the Diseases of Poverty
- Page 33 and 34: 4 Fighting the Diseases of Poverty
- Page 35 and 36: 6 Fighting the Diseases of Poverty
- Page 37 and 38: 8 Fighting the Diseases of Poverty
- Page 39 and 40: 10 Fighting the Diseases of Poverty
- Page 41 and 42: 12 Fighting the Diseases of Poverty
- Page 43 and 44: 14 Fighting the Diseases of Poverty
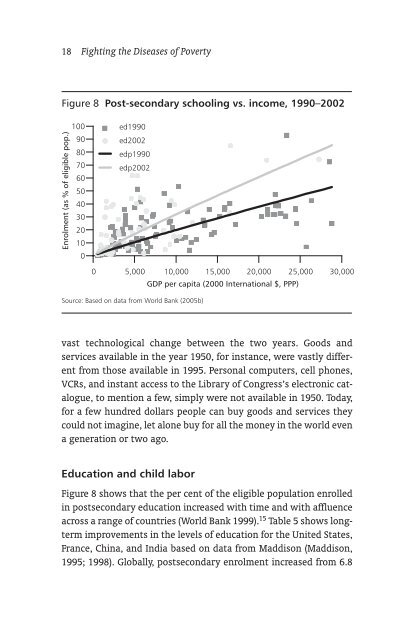
- Page 45: 16 Fighting the Diseases of Poverty
- Page 49 and 50: 20 Fighting the Diseases of Poverty
- Page 51 and 52: 22 Fighting the Diseases of Poverty
- Page 53 and 54: 24 Fighting the Diseases of Poverty
- Page 55 and 56: 26 Fighting the Diseases of Poverty
- Page 57 and 58: 28 Fighting the Diseases of Poverty
- Page 59 and 60: 30 Fighting the Diseases of Poverty
- Page 61 and 62: 32 Fighting the Diseases of Poverty
- Page 63 and 64: 34 Fighting the Diseases of Poverty
- Page 65 and 66: 2 South Africa’s healthcare under
- Page 67 and 68: 38 Fighting the Diseases of Poverty
- Page 69 and 70: 40 Fighting the Diseases of Poverty
- Page 71 and 72: 42 Fighting the Diseases of Poverty
- Page 73 and 74: 44 Fighting the Diseases of Poverty
- Page 75 and 76: 46 Fighting the Diseases of Poverty
- Page 77 and 78: 48 Fighting the Diseases of Poverty
- Page 79 and 80: 50 Fighting the Diseases of Poverty
- Page 81 and 82: 52 Fighting the Diseases of Poverty
- Page 83 and 84: 54 Fighting the Diseases of Poverty
- Page 85 and 86: 56 Fighting the Diseases of Poverty
- Page 87 and 88: 58 Fighting the Diseases of Poverty
- Page 89 and 90: 60 Fighting the Diseases of Poverty
- Page 91 and 92: 62 Fighting the Diseases of Poverty
- Page 93 and 94: 64 Fighting the Diseases of Poverty
- Page 95 and 96: 66 Fighting the Diseases of Poverty
- Page 97 and 98:
68 Fighting the Diseases of Poverty
- Page 99 and 100:
70 Fighting the Diseases of Poverty
- Page 101 and 102:
72 Fighting the Diseases of Poverty
- Page 103 and 104:
74 Fighting the Diseases of Poverty
- Page 105 and 106:
76 Fighting the Diseases of Poverty
- Page 107 and 108:
78 Fighting the Diseases of Poverty
- Page 109 and 110:
80 Fighting the Diseases of Poverty
- Page 111 and 112:
82 Fighting the Diseases of Poverty
- Page 113 and 114:
84 Fighting the Diseases of Poverty
- Page 115 and 116:
86 Fighting the Diseases of Poverty
- Page 117 and 118:
88 Fighting the Diseases of Poverty
- Page 119 and 120:
90 Fighting the Diseases of Poverty
- Page 121 and 122:
92 Fighting the Diseases of Poverty
- Page 123 and 124:
94 Fighting the Diseases of Poverty
- Page 125 and 126:
96 Fighting the Diseases of Poverty
- Page 127 and 128:
98 Fighting the Diseases of Poverty
- Page 129 and 130:
100 Fighting the Diseases of Povert
- Page 131 and 132:
102 Fighting the Diseases of Povert
- Page 133 and 134:
104 Fighting the Diseases of Povert
- Page 135 and 136:
106 Fighting the Diseases of Povert
- Page 137 and 138:
108 Fighting the Diseases of Povert
- Page 139 and 140:
110 Fighting the Diseases of Povert
- Page 141 and 142:
112 Fighting the Diseases of Povert
- Page 143 and 144:
114 Fighting the Diseases of Povert
- Page 145 and 146:
116 Fighting the Diseases of Povert
- Page 147 and 148:
118 Fighting the Diseases of Povert
- Page 149 and 150:
120 Fighting the Diseases of Povert
- Page 151 and 152:
122 Fighting the Diseases of Povert
- Page 153 and 154:
124 Fighting the Diseases of Povert
- Page 155 and 156:
4 Diseases of poverty and the 10/90
- Page 157 and 158:
128 Fighting the Diseases of Povert
- Page 159 and 160:
130 Fighting the Diseases of Povert
- Page 161 and 162:
132 Fighting the Diseases of Povert
- Page 163 and 164:
134 Fighting the Diseases of Povert
- Page 165 and 166:
136 Fighting the Diseases of Povert
- Page 167 and 168:
138 Fighting the Diseases of Povert
- Page 169 and 170:
140 Fighting the Diseases of Povert
- Page 171 and 172:
142 Fighting the Diseases of Povert
- Page 173 and 174:
144 Fighting the Diseases of Povert
- Page 175 and 176:
146 Fighting the Diseases of Povert
- Page 177 and 178:
148 Fighting the Diseases of Povert
- Page 179 and 180:
150 Fighting the Diseases of Povert
- Page 181 and 182:
152 Fighting the Diseases of Povert
- Page 183 and 184:
154 Fighting the Diseases of Povert
- Page 185 and 186:
156 Fighting the Diseases of Povert
- Page 187 and 188:
158 Fighting the Diseases of Povert
- Page 189 and 190:
160 Fighting the Diseases of Povert
- Page 191 and 192:
162 Fighting the Diseases of Povert
- Page 193 and 194:
164 Fighting the Diseases of Povert
- Page 195 and 196:
166 Fighting the Diseases of Povert
- Page 197 and 198:
168 Fighting the Diseases of Povert
- Page 199 and 200:
170 Fighting the Diseases of Povert
- Page 201 and 202:
172 Fighting the Diseases of Povert
- Page 203 and 204:
174 Fighting the Diseases of Povert
- Page 205 and 206:
176 Fighting the Diseases of Povert
- Page 207 and 208:
178 Fighting the Diseases of Povert
- Page 209 and 210:
180 Fighting the Diseases of Povert
- Page 211 and 212:
182 Fighting the Diseases of Povert
- Page 214 and 215:
6 Cost effective means of fighting
- Page 216 and 217:
Cost effective means of fighting th
- Page 218 and 219:
Cost effective means of fighting th
- Page 220 and 221:
Cost effective means of fighting th
- Page 222 and 223:
Cost effective means of fighting th
- Page 224 and 225:
Cost effective means of fighting th
- Page 226 and 227:
Cost effective means of fighting th
- Page 228 and 229:
Cost effective means of fighting th
- Page 230 and 231:
Cost effective means of fighting th
- Page 232 and 233:
7 Counterfeit medicines in LDCs: pr
- Page 234 and 235:
Counterfeit medicines in LDCs: prob
- Page 236 and 237:
Counterfeit medicines in LDCs: prob
- Page 238 and 239:
Counterfeit medicines in LDCs: prob
- Page 240 and 241:
Counterfeit medicines in LDCs: prob
- Page 242 and 243:
Counterfeit medicines in LDCs: prob
- Page 244 and 245:
The value of vaccination 215 In the
- Page 246 and 247:
The value of vaccination 217 the di
- Page 248 and 249:
The value of vaccination 219 ◆
- Page 250 and 251:
The value of vaccination 221 Figure
- Page 252 and 253:
The value of vaccination 223 vaccin
- Page 254 and 255:
The value of vaccination 225 moreov
- Page 256 and 257:
The value of vaccination 227 encour
- Page 258 and 259:
The value of vaccination 229 packag
- Page 260 and 261:
The value of vaccination 231 longer
- Page 262 and 263:
The value of vaccination 233 2005 t
- Page 264 and 265:
The value of vaccination 235 long-t
- Page 266 and 267:
The value of vaccination 237 Table
- Page 268 and 269:
9 The World Health Organisation: a
- Page 270 and 271:
The World Health Organisation: a ti
- Page 272 and 273:
The World Health Organisation: a ti
- Page 274 and 275:
The World Health Organisation: a ti
- Page 276 and 277:
The World Health Organisation: a ti
- Page 278 and 279:
The World Health Organisation: a ti
- Page 280 and 281:
The World Health Organisation: a ti
- Page 282 and 283:
The World Health Organisation: a ti
- Page 284 and 285:
The World Health Organisation: a ti
- Page 286 and 287:
The World Health Organisation: a ti
- Page 288 and 289:
The World Health Organisation: a ti
- Page 290 and 291:
The World Health Organisation: a ti
- Page 292 and 293:
The World Health Organisation: a ti
- Page 294 and 295:
Notes Introduction 1 The UN Human D
- Page 296 and 297:
Notes 267 18 The decline in their G
- Page 298 and 299:
Notes 269 4 The diseases of poverty
- Page 300 and 301:
Notes 271 to high-levels of researc
- Page 302 and 303:
Notes 273 to register new products,
- Page 304 and 305:
Notes 275 2 Snow, B et al., “The
- Page 306 and 307:
Sources 277 Karoly, L., Greenwood,
- Page 308 and 309:
Sources 279 ——— . 2004. The S
- Page 310 and 311:
Sources 281 University, March 13. A
- Page 312 and 313:
Sources 283 Alcazar, L and Andrade,
- Page 314 and 315:
Sources 285 Di Tella, R. and Savedo
- Page 316 and 317:
Sources 287 La Forgia, G. 2005. Hea
- Page 318 and 319:
Sources 289 Shishkin, Sergey. 2003.
- Page 320 and 321:
Sources 291 4 The diseases of pover
- Page 322 and 323:
Sources 293 Wofford, D., & Shanahan
- Page 324 and 325:
Sources 295 6 Cost effective means
- Page 326 and 327:
Sources 297 7 Counterfeit medicines
- Page 328 and 329:
The Campaign for Fighting Diseases
- Page 330 and 331:
Dr. Henry I. Miller joined the Food


![[June 2008, Volume V Quarterly Issue] Pdf File size - The IIPM Think ...](https://img.yumpu.com/31747104/1/190x245/june-2008-volume-v-quarterly-issue-pdf-file-size-the-iipm-think-.jpg?quality=85)