Annual Report 2008 - Ministry of Finance and Planning
Annual Report 2008 - Ministry of Finance and Planning
Annual Report 2008 - Ministry of Finance and Planning

Create successful ePaper yourself
Turn your PDF publications into a flip-book with our unique Google optimized e-Paper software.
3. Performance <strong>of</strong> Public Enterprises<br />
153<br />
Loans <strong>and</strong> Advances Portfolio <strong>of</strong> RDBs<br />
The net loans <strong>and</strong> advances <strong>of</strong> RDBs amounting to Rs.<br />
26,315 million by the end <strong>of</strong> <strong>2008</strong> indicating an increase <strong>of</strong><br />
10.7 percent over last year. Although net loans <strong>and</strong> advances<br />
<strong>of</strong> RDBs have increased over last few years, the growth<br />
momentum has been gradually moderated.<br />
Pawning advances to total loan portfolio <strong>of</strong> RDBs has<br />
increased from 29.6 per cent in 2007 to 33.3 percent in <strong>2008</strong>.<br />
However, this ratio exceeded 50 per cent in SDB <strong>and</strong> 40 per<br />
cent in RaDB in <strong>2008</strong>.<br />
A significant portion <strong>of</strong> RDB’s loans has been channeled to<br />
housing loans (27 percent) while a 20.5 per cent has been<br />
granted for agriculture related activities. RDBs’ exposure<br />
to agriculture sector has increased in <strong>2008</strong> in comparison<br />
to 2007. Small industries sector has received only 12.% in<br />
<strong>2008</strong>.<br />
Table 3.12<br />
Performance <strong>of</strong> RDBs<br />
2006 2007 <strong>2008</strong><br />
Number <strong>of</strong> Branches 209 211 215<br />
Number <strong>of</strong> Employees 1,908 1,986 1,934<br />
Assets (Rs. bn) 26.1 31.0 34.4<br />
Deposits (Rs. bn) 18.7 21.9 25.9<br />
Corporate & Retail Lending<br />
(Rs. bn) 19.3 23.0 26.3<br />
Pr<strong>of</strong>it before Tax (Rs. mn) 633 814 1,037<br />
Pr<strong>of</strong>it After Tax (Rs,mn) 299 416 424<br />
Capital Adequacy Ratio (1) 9.0-14.4 8.2-15.1 8.4 -<br />
15.0<br />
Capital Adequacy Ratio (11) 11.4 - 9.8 - 8.9 -<br />
18.1 15.7 15.8<br />
Non Performing Loans (Rs.mn) 1,161 1,252 1214<br />
Non Performing Loan Ratio 5.6 5.3 4.5<br />
Source: Bank’s <strong>Annual</strong> Accounts<br />
Non Performing Loans <strong>and</strong> Advances <strong>of</strong> RDBs<br />
The improvement in assets quality <strong>of</strong> RDBs has contributed<br />
towards the reduction <strong>of</strong> non-performing ratio in many<br />
RDBs. The non-performing advances declined from Rs. 1,252<br />
million in 2007 to Rs. 1214 million in <strong>2008</strong> indicating a 3.0<br />
percent decline. However, gross loans <strong>and</strong> advances have<br />
increased from Rs. 23,767 million in 2007 to Rs. 27,156 million<br />
in <strong>2008</strong> recording an increase <strong>of</strong> 14.2 percent. Accordingly,<br />
Gross Non-performing Loan Ratio (NPL) has declined from<br />
5.3 percent in 2007 to 4.5 percent in <strong>2008</strong> due to the increase<br />
in total advances over the period.<br />
Table 3.13<br />
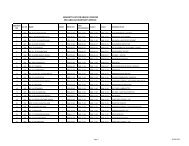
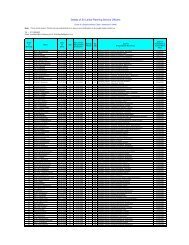
Purpose- wise Distribution <strong>of</strong> Loans <strong>and</strong> Advances by RDBs in <strong>2008</strong><br />
RaDB RuDB WDB KDB UDB SDB Total<br />
Rs. (%) Rs. (%) Rs. (%) Rs. (%) Rs. (%) Rs. (%) Rs. (%)<br />
mn mn mn mn mn mn mn<br />
Agriculture 1,326 50 1,292 23 1,293 18 218 6 718 29 626 11 5,473 21<br />
Manufacture 130 5 618 12 1,374 20 84 3 367 15 626 11 3,199 12<br />
Housing 418 16 1,336 24 2,851 40 184 5 736 30 1,528 29 7,053 26<br />
Consumption 263 10 847 15 479 6 1,331 38 468 19 381 7 3,769 14<br />
Services* 119 4 861 15 534 8 294 8 1 0 1,186 22 2,995, 11<br />
Others 408 15 620 11 524 8 1,422 40 168 7 1,114 20 4,256 16<br />
Total 2,664 100 5,574 100 7,055 100 3,533 100 2,458 100 5,461 100 26,745 100<br />
Source:- <strong>Annual</strong> Accounts <strong>2008</strong><br />
*including loans classified as Trade <strong>and</strong> Commerce SDB<br />
<strong>Ministry</strong> <strong>of</strong> <strong>Finance</strong> <strong>and</strong> <strong>Planning</strong> Sri Lanka<br />
<strong>Annual</strong> <strong>Report</strong> <strong>2008</strong>