Annual Report 2008 - Ministry of Finance and Planning
Annual Report 2008 - Ministry of Finance and Planning
Annual Report 2008 - Ministry of Finance and Planning

You also want an ePaper? Increase the reach of your titles
YUMPU automatically turns print PDFs into web optimized ePapers that Google loves.
3. Performance <strong>of</strong> Public Enterprises<br />
161<br />
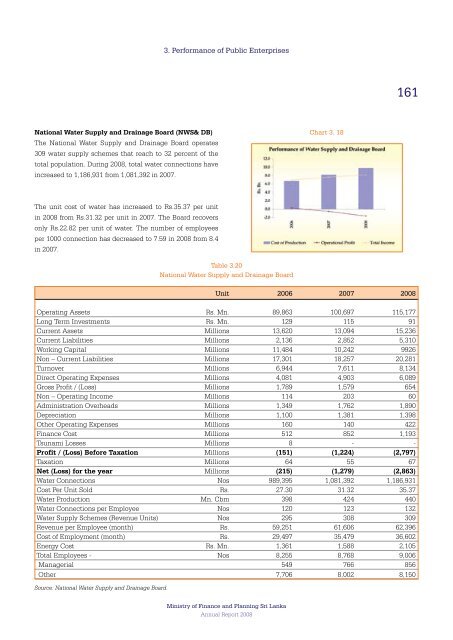
National Water Supply <strong>and</strong> Drainage Board (NWS& DB)<br />
The National Water Supply <strong>and</strong> Drainage Board operates<br />
309 water supply schemes that reach to 32 percent <strong>of</strong> the<br />
total population. During <strong>2008</strong>, total water connections have<br />
increased to 1,186,931 from 1,081,392 in 2007.<br />
Chart 3. 18<br />
The unit cost <strong>of</strong> water has increased to Rs.35.37 per unit<br />
in <strong>2008</strong> from Rs.31.32 per unit in 2007. The Board recovers<br />
only Rs.22.82 per unit <strong>of</strong> water. The number <strong>of</strong> employees<br />
per 1000 connection has decreased to 7.59 in <strong>2008</strong> from 8.4<br />
in 2007.<br />
Table 3.20<br />
National Water Supply <strong>and</strong> Drainage Board<br />
Unit 2006 2007 <strong>2008</strong><br />
Operating Assets Rs. Mn. 89,863 100,697 115,177<br />
Long Term Investments Rs. Mn. 129 115 91<br />
Current Assets Millions 13,620 13,094 15,236<br />
Current Liabilities Millions 2,136 2,852 5,310<br />
Working Capital Millions 11,484 10,242 9926<br />
Non – Current Liabilities Millions 17,301 18,257 20,281<br />
Turnover Millions 6,944 7,611 8,134<br />
Direct Operating Expenses Millions 4,081 4,903 6,089<br />
Gross Pr<strong>of</strong>it / (Loss) Millions 1,789 1,579 654<br />
Non – Operating Income Millions 114 203 60<br />
Administration Overheads Millions 1,349 1,762 1,890<br />
Depreciation Millions 1,100 1,381 1,398<br />
Other Operating Expenses Millions 160 140 422<br />
<strong>Finance</strong> Cost Millions 512 852 1,193<br />
Tsunami Losses Millions 8 - -<br />
Pr<strong>of</strong>it / (Loss) Before Taxation Millions (151) (1,224) (2,797)<br />
Taxation Millions 64 55 67<br />
Net (Loss) for the year Millions (215) (1,279) (2,863)<br />
Water Connections Nos 989,395 1,081,392 1,186,931<br />
Cost Per Unit Sold Rs. 27.30 31.32 35.37<br />
Water Production Mn. Cbm 398 424 440<br />
Water Connections per Employee Nos 120 123 132<br />
Water Supply Schemes (Revenue Units) Nos 295 308 309<br />
Revenue per Employee (month) Rs. 59,251 61,606 62,396<br />
Cost <strong>of</strong> Employment (month) Rs. 29,497 35,479 36,602<br />
Energy Cost Rs. Mn. 1,361 1,588 2,105<br />
Total Employees - Nos 8,255 8,768 9,006<br />
Managerial 549 766 856<br />
Other 7,706 8,002 8,150<br />
Source: National Water Supply <strong>and</strong> Drainage Board.<br />
<strong>Ministry</strong> <strong>of</strong> <strong>Finance</strong> <strong>and</strong> <strong>Planning</strong> Sri Lanka<br />
<strong>Annual</strong> <strong>Report</strong> <strong>2008</strong>