Annual Report 2008 - Ministry of Finance and Planning
Annual Report 2008 - Ministry of Finance and Planning
Annual Report 2008 - Ministry of Finance and Planning

You also want an ePaper? Increase the reach of your titles
YUMPU automatically turns print PDFs into web optimized ePapers that Google loves.
6. A Sectoral Perspective<br />
252<br />
In terms <strong>of</strong> the inl<strong>and</strong> fisheries sector, several steps have<br />
been taken to improve the infrastructure facilities, enterprise<br />
development, <strong>and</strong> community empowerment under the<br />
Aquatic Resources Development <strong>and</strong> Quality Improvement<br />
Project funded by the Asian Development Bank (ADB). All<br />
Regional Aquatic Development Centres improved under the<br />
project. Loans amounted to Rs. 10 million were distributed<br />
among micro enterprises to improve the fishing operations.<br />
Fingerlings were stocked in 31 perennial tanks under the<br />
Community Based Management Project. In addition,<br />
1,061,475 fingerlings were released to tanks free <strong>of</strong> charge<br />
by the National Aquatic Resources Development Authority<br />
(NAQDA) during the year.<br />
Several measures were introduced to improve the marketing<br />
facilities <strong>of</strong> wholesale <strong>and</strong> retail distribution <strong>of</strong> fish under the<br />
modern st<strong>and</strong>ards. A guaranteed price scheme continued in<br />
<strong>2008</strong> <strong>and</strong> 161 metric tons <strong>of</strong> fish were purchased by the Ceylon<br />
fisheries Corporation (CFC). The construction <strong>of</strong> the wholesale<br />
<strong>and</strong> retail fish market at Peliyagoda had commenced. The<br />
construction <strong>of</strong> fish markets in Trincomalee, Hambantota,<br />
Polonnaruwa <strong>and</strong> Puttlam were also completed in <strong>2008</strong>.<br />
Importation <strong>of</strong> food items<br />
The import expenditure on food <strong>and</strong> beverages sector<br />
increased by 41 percent in <strong>2008</strong> amounting to US$ 1,505<br />
million. This accounts to 16.2 percent <strong>of</strong> the total imports.<br />
Particularly due to the increased international prices <strong>of</strong><br />
wheat, milk powder <strong>and</strong> sugar observed in the first half <strong>of</strong><br />
<strong>2008</strong>. A wider spectrum <strong>of</strong> imports <strong>of</strong> food items indicates<br />
the future need <strong>and</strong> prospects for increased local food<br />
production, to reach self sufficiency <strong>and</strong> value addition.<br />
Accordingly, a local food production drive, “Api Wavamu-<br />
Rata Nagamu” programmme was initiated to achieve these<br />
policy objectives. Government continued channeling funds<br />
for enhancing agricultural credit facilities, developing<br />
irrigation facilities, providing quality seeds <strong>and</strong> planting<br />
material, providing fertilizer subsidy while measures were<br />
implemented to safeguard from unfair import competition.<br />
Also, agriculture has been exempted from income tax, VAT<br />
<strong>and</strong> Nation Building Tax.<br />
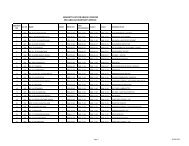
Table 6.16<br />
Major Food Items Imports<br />
Year 2005 2006 2007 <strong>2008</strong> (Provisional)<br />
Item<br />
Quantity<br />
(MT)<br />
Value CIF<br />
(Rs. mn.)<br />
Quantity<br />
(MT)<br />
Value CIF<br />
(Rs. mn.)<br />
Quantity<br />
(MT)<br />
Value CIF<br />
(Rs. mn.)<br />
Quantity<br />
(MT)<br />
Value CIF<br />
(Rs. mn.)<br />
Rice 51,729 1,554 11,536 577 88,003 1,261 118,554 5,067<br />
Wheat 956,148 15,798 1,174,604 20,473 854,864 22,756 661,421 40,820<br />
Wheat Flour 150,436 3,200 13,578 321 5,797 229 1,969 92<br />
Sugar 444,244 14,096 520,599 22,970 470,706 16,346 541,568 22,000<br />
Dhal 84,396 3,100 104,807 3,802 103,195 6,593 79,751 9,001<br />
Chillies 27,261 1,629 29,410 2,739 31,242 4,080 35,284 4,579<br />
Red Onions 10,233 304 10,859 377 23,754 949 28,019 1,622<br />
Big Onions 110,713 1,826 119,478 1,940 140,728 4,392 154,498 3,790<br />
Potatoes 46,464 1,117 48,799 1,266 85,929 2,211 105,544 2,672<br />
Dried Fish 50,284 3,784 50,455 5,507 51,743 6,253 48,924 6,110<br />
Milk Powder 52,800 12,581 68,105 16,716 62,081 19,318 63,774 30,581<br />
Vegetables 925 98 708 119 733 154 309 62<br />
Fruits 38,656 1,336 40,806 1,498 37,242 1,551 39,062 1,471<br />
Fish 5,310 775 6,986 1,291 11,152 1,863 5,136 389<br />
Meat 2,560 291 1,065 186 1,710 258 1,394 173<br />
Total 61,489 79,782 88,214 128,409<br />
Source: Statistics Division, Department <strong>of</strong> Sri Lanka Customs<br />
<strong>Ministry</strong> <strong>of</strong> <strong>Finance</strong> <strong>and</strong> <strong>Planning</strong> Sri Lanka<br />
<strong>Annual</strong> <strong>Report</strong> <strong>2008</strong>