here - Ayala
here - Ayala
here - Ayala

You also want an ePaper? Increase the reach of your titles
YUMPU automatically turns print PDFs into web optimized ePapers that Google loves.
Globe 2012 annual report<br />
financial report<br />
As of December 31, 2012, Innove, GXI, GTI and KVI reported net input VAT amounting to P=638.63 million, net<br />
of output VAT of P=110.94 million. As of December 31, 2011, Innove and GXI reported net input VAT amounting<br />
to P=844.09 million, net of output VAT of P=94.36 million. As of December 31, 2010, Innove, GXI and EGG<br />
reported net input VAT amounting to P=954.64 million, net of output VAT of P=102.45 million.<br />
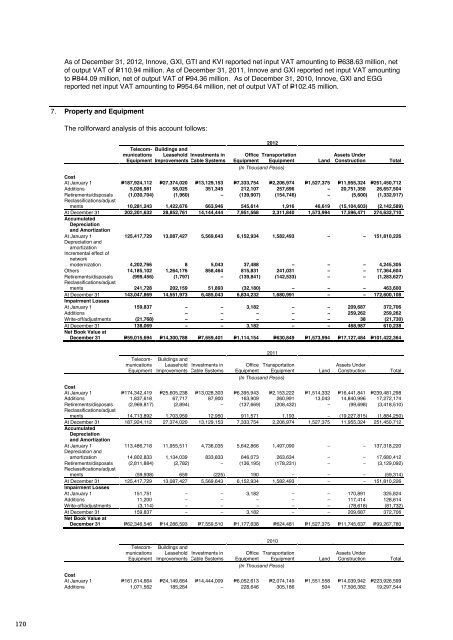
7. Property and Equipment<br />
The rollforward analysis of this account follows:<br />
Telecommunications<br />
Equipment<br />
Buildings and<br />
Leasehold<br />
Improvements<br />
Investments in<br />
Cable Systems<br />
2012<br />
Office Transportation<br />
Equipment Equipment<br />
(In Thousand Pesos)<br />
Land<br />
Assets Under<br />
Construction<br />
Cost<br />
At January 1 P=187,924,112 P=27,374,020 P=13,129,153 P=7,333,754 P=2,206,974 P=1,527,375 P=11,955,324 P=251,450,712<br />
Additions 5,026,981 58,025 351,345 212,107 257,696 – 20,751,350 26,657,504<br />
Retirements/disposals (1,030,704) (1,960) – (139,907) (154,746) – (5,600) (1,332,917)<br />
Reclassifications/adjust<br />
ments 10,281,243 1,422,676 663,946 545,614 1,916 46,619 (15,104,603) (2,142,589)<br />
At December 31 202,201,632 28,852,761 14,144,444 7,951,568 2,311,840 1,573,994 17,596,471 274,632,710<br />
Accumulated<br />
Depreciation<br />
and Amortization<br />
At January 1 125,417,729 13,087,427 5,569,643 6,152,934 1,582,493 – – 151,810,226<br />
Depreciation and<br />
amortization<br />
Incremental effect of<br />
network<br />
modernization 4,202,766 8 5,043 37,488 – – – 4,245,305<br />
Others 14,185,102 1,264,176 858,464 815,831 241,031 – – 17,364,604<br />
Retirements/disposals (999,456) (1,797) – (139,841) (142,533) – – (1,283,627)<br />
Reclassifications/adjust<br />
ments 241,728 202,159 51,893 (32,180) – – – 463,600<br />
At December 31 143,047,869 14,551,973 6,485,043 6,834,232 1,680,991 – – 172,600,108<br />
Impairment Losses<br />
At January 1 159,837 – – 3,182 – – 209,687 372,706<br />
Additions – – – – – – 259,262 259,262<br />
Write-off/adjustments (21,768) – – – – – 38 (21,730)<br />
At December 31 138,069 – – 3,182 – – 468,987 610,238<br />
Net Book Value at<br />
December 31 P=59,015,694 P=14,300,788 P=7,659,401 P=1,114,154 P=630,849 P=1,573,994 P=17,127,484 P=101,422,364<br />
Telecommunications<br />
Equipment<br />
Buildings and<br />
Leasehold<br />
Improvements<br />
Investments in<br />
Cable Systems<br />
Office<br />
Equipment<br />
2011<br />
Transportation<br />
Equipment<br />
(In Thousand Pesos)<br />
Land<br />
Assets Under<br />
Construction<br />
Cost<br />
At January 1 P=174,342,419 P=25,605,238 P=13,028,303 P=6,395,943 P=2,153,222 P=1,514,332 P=16,441,841 P=239,481,298<br />
Additions 1,837,618 67,717 87,900 163,909 260,991 13,043 14,840,996 17,272,174<br />
Retirements/disposals (2,969,817) (2,894) – (137,669) (208,432) – (99,698) (3,418,510)<br />
Reclassifications/adjust<br />
ments 14,713,892 1,703,959 12,950 911,571 1,193 – (19,227,815) (1,884,250)<br />
At December 31 187,924,112 27,374,020 13,129,153 7,333,754 2,206,974 1,527,375 11,955,324 251,450,712<br />
Accumulated<br />
Depreciation<br />
and Amortization<br />
At January 1 113,486,718 11,955,511 4,736,035 5,642,866 1,497,090 – – 137,318,220<br />
Depreciation and<br />
amortization 14,802,833 1,134,039 833,833 646,073 263,634 – – 17,680,412<br />
Retirements/disposals (2,811,884) (2,782) – (136,195) (178,231) – – (3,129,092)<br />
Reclassifications/adjust<br />
ments (59,938) 659 (225) 190 – – – (59,314)<br />
At December 31 125,417,729 13,087,427 5,569,643 6,152,934 1,582,493 – – 151,810,226<br />
Impairment Losses<br />
At January 1 151,751 – – 3,182 – – 170,891 325,824<br />
Additions 11,200 – – – – – 117,414 128,614<br />
Write-off/adjustments (3,114) – – – – – (78,618) (81,732)<br />
At December 31 159,837 – – 3,182 – – 209,687 372,706<br />
Net Book Value at<br />
December 31 P=62,346,546 P=14,286,593 P=7,559,510 P=1,177,638 P=624,481 P=1,527,375 P=11,745,637 P=99,267,780<br />
Total<br />
Total<br />
Retirements/disposals (408,040) (29,092) – (87,113) (237,996) (14,025) (4,162) (780,428)<br />
Reclassifications/adjust<br />
ments 12,064,233 1,299,402 (1,415,706) 201,797 11,883 (23,705) (15,100,321) (2,962,417)<br />
At December 31 174,342,419 25,605,238 13,028,303 6,395,943 2,153,222 1,514,332 16,441,841 239,481,298<br />
Accumulated<br />
Depreciation and<br />
Amortization<br />
At January 1 99,668,498 11,009,763 4,758,210 5,065,820 1,431,233 – – 121,933,524<br />
Depreciation and<br />
amortization 14,403,724 1,054,839 899,440 693,641 265,153 – – 17,316,797<br />
Retirements/disposals (354,424) (25,502) – (81,707) (207,716) – – (669,349)<br />
Reclassifications/adjust<br />
ments (231,080) (83,589) (921,615) (34,888) 8,420 – – (1,262,752)<br />
At December 31 113,486,718 11,955,511 4,736,035 5,642,866 1,497,090 – – 137,318,220<br />
Impairment Losses<br />
At January 1 185,138 – – 3,182 – – 110,887 299,207<br />
Additions – – – – – – 57,805 57,805<br />
Write-off/adjustments (33,387) – – – – – 2,199 (31,188)<br />
At December 31 151,751 – – 3,182 – – 170,891 325,824<br />
Net Book Value at<br />
December 31 P=60,703,950 P=13,649,727 P=8,292,268 P=749,895 P=656,132 P=1,514,332 P=16,270,950 P=101,837,254<br />
In the last quarter of 2011, Globe Group has announced to undertake a network and IT transformation program<br />
for an estimated investment of USD790.00 million over the next two to three years. External partners were<br />
engaged in 2011 to help manage the modernization effort. In the first quarter of 2012, the EUL of certain<br />
wireless and wireline telecommunications equipment were changed as a result of continuing upgrade and<br />
migration to a modernized network. The net effect of the change in EUL resulted in higher depreciation expense<br />
of P=4,245.30 million for the year ended December 31, 2012.<br />
Assets under construction include intangible components of a network system which are reclassified to<br />
depreciable intangible assets only when assets become available for use (see Note 9).<br />
Investments in cable systems include the cost of the Globe Group’s ownership share in the capacity of certain<br />
cable systems under a joint venture or a consortium or private cable set-up and indefeasible rights of use (IRUs)<br />
of circuits in various cable systems. It also includes the cost of cable landing station and transmission facilities<br />
w<strong>here</strong> the Globe Group is the landing party.<br />
The costs of fully depreciated property and equipment that are still being used in the network amounted to<br />
P=87,165.41 million, P=70,229.60 million and P=52,467.14 million as of December 31, 2012, 2011 and 2010,<br />
respectively.<br />
The Globe Group uses its borrowed funds to finance the acquisition of property and equipment and bring it to its<br />
intended location and working condition. Borrowing costs incurred relating to these acquisitions were included<br />
in the cost of property and equipment using 3.01%, 3.19% and 5.61% capitalization rates in 2012, 2011 and<br />
2010, respectively. The Globe Group’s total capitalized borrowing costs amounted to P=808.25 million,<br />
P=591.66 million and P=1,091.21 million for the years ended December 31, 2012, 2011 and 2010, respectively<br />
(see Note 22).<br />
In 2011, the Globe Group entered into a sale-buy back transaction with an equipment supplier w<strong>here</strong>by Globe<br />
Group conveyed and transferred ownership of certain hardware equipment and licenses nearing end of<br />
economic life and then later purchased upgraded equipment from the same equipment supplier. This<br />
transaction resulted in a gain amounting to P=244.37 million (included under “Gain on disposal of property and<br />
equipment - net” in the consolidated statements of comprehensive income), equivalent to the difference<br />
between the fair value of the new equipment and the carrying amount of the old platforms and equipment at the<br />
time the transaction was consummated.<br />
The carrying value of the hardware infrastructure and information equipment held under finance lease (included<br />
under “Telecommunications equipment”) at December 31, 2012 amounted to P=738.09 million (see Note 25.1.2).<br />
Telecommunications<br />
Equipment<br />
Buildings and<br />
Leasehold<br />
Improvements<br />
Investments in<br />
Cable Systems<br />
Office<br />
Equipment<br />
2010<br />
Transportation<br />
Equipment<br />
(In Thousand Pesos)<br />
Land<br />
Assets Under<br />
Construction<br />
Cost<br />
At January 1 P=161,614,664 P=24,149,664 P=14,444,009 P=6,052,613 P=2,074,149 P=1,551,558 P=14,039,942 P=223,926,599<br />
Additions 1,071,562 185,264 – 228,646 305,186 504 17,506,382 19,297,544<br />
Total<br />
170 171