here - Ayala
here - Ayala
here - Ayala

You also want an ePaper? Increase the reach of your titles
YUMPU automatically turns print PDFs into web optimized ePapers that Google loves.
Globe 2012 annual report<br />
financial report<br />
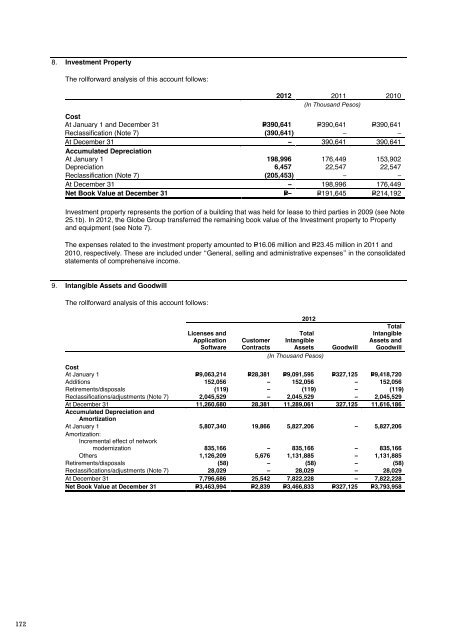
8. Investment Property<br />
The rollforward analysis of this account follows:<br />
2012 2011 2010<br />
(In Thousand Pesos)<br />
Cost<br />
At January 1 and December 31 P=390,641 P=390,641 P=390,641<br />
Reclassification (Note 7) (390,641) – –<br />
At December 31 – 390,641 390,641<br />
Accumulated Depreciation<br />
At January 1 198,996 176,449 153,902<br />
Depreciation 6,457 22,547 22,547<br />
Reclassification (Note 7) (205,453) – –<br />
At December 31 – 198,996 176,449<br />
Net Book Value at December 31 P=– P=191,645 P=214,192<br />
Investment property represents the portion of a building that was held for lease to third parties in 2009 (see Note<br />
25.1b). In 2012, the Globe Group transferred the remaining book value of the Investment property to Property<br />
and equipment (see Note 7).<br />
The expenses related to the investment property amounted to P=16.06 million and P=23.45 million in 2011 and<br />
2010, respectively. These are included under “General, selling and administrative expenses” in the consolidated<br />
statements of comprehensive income.<br />
9. Intangible Assets and Goodwill<br />
The rollforward analysis of this account follows:<br />
Licenses and<br />
Application<br />
Software<br />
2012<br />
Total<br />
Customer Intangible<br />
Contracts Assets<br />
(In Thousand Pesos)<br />
Goodwill<br />
Total<br />
Intangible<br />
Assets and<br />
Goodwill<br />
Cost<br />
At January 1 P=9,063,214 P=28,381 P=9,091,595 P=327,125 P=9,418,720<br />
Additions 152,056 – 152,056 – 152,056<br />
Retirements/disposals (119) – (119) – (119)<br />
Reclassifications/adjustments (Note 7) 2,045,529 – 2,045,529 – 2,045,529<br />
At December 31 11,260,680 28,381 11,289,061 327,125 11,616,186<br />
Accumulated Depreciation and<br />
Amortization<br />
At January 1 5,807,340 19,866 5,827,206 – 5,827,206<br />
Amortization:<br />
Incremental effect of network<br />
modernization 835,166 – 835,166 – 835,166<br />
Others 1,126,209 5,676 1,131,885 – 1,131,885<br />
Retirements/disposals (58) – (58) – (58)<br />
Reclassifications/adjustments (Note 7) 28,029 – 28,029 – 28,029<br />
At December 31 7,796,686 25,542 7,822,228 – 7,822,228<br />
Net Book Value at December 31 P=3,463,994 P=2,839 P=3,466,833 P=327,125 P=3,793,958<br />
No impairment loss on intangible assets was recognized in 2012.<br />
Licenses and<br />
Application<br />
Software<br />
2011<br />
Total<br />
Customer Intangible<br />
Contracts Assets<br />
(In Thousand Pesos)<br />
Goodwill<br />
Total<br />
Intangible<br />
Assets and<br />
Goodwill<br />
Cost<br />
At January 1 P=8,362,110 P=28,381 P=8,390,491 P=327,125 P=8,717,616<br />
Additions 145,208 – 145,208 – 145,208<br />
Retirements/disposals (862,847) – (862,847) – (862,847)<br />
Reclassifications/adjustments (Note 7) 1,418,743 – 1,418,743 – 1,418,743<br />
At December 31 9,063,214 28,381 9,091,595 327,125 9,418,720<br />
Accumulated Depreciation and<br />
Amortization<br />
At January 1 P=5,449,729 P=14,190 P=5,463,919 P=– P=5,463,919<br />
Amortization 1,232,592 5,676 1,238,268 – 1,238,268<br />
Retirements/disposals (848,131) – (848,131) – (848,131)<br />
Reclassifications/adjustments (Note 7) (26,850) – (26,850) – (26,850)<br />
At December 31 5,807,340 19,866 5,827,206 – 5,827,206<br />
Impairment Losses<br />
At January 1 5,321 – 5,321 – 5,321<br />
Write-off/adjustments (5,321) – (5,321) – (5,321)<br />
At December 31 – – – – –<br />
Net Book Value at December 31 P=3,255,874 P=8,515 P=3,264,389 P=327,125 P=3,591,514<br />
Licenses and<br />
Application<br />
Software<br />
2010<br />
Total<br />
Customer Intangible<br />
Contracts Assets<br />
(In Thousand Pesos)<br />
Goodwill<br />
Total<br />
Intangible<br />
Assets and<br />
Goodwill<br />
Cost<br />
At January 1 P=7,431,159 P=28,381 P=7,459,540 P=327,125 P=7,786,665<br />
Additions 169,329 – 169,329 – 169,329<br />
Retirements/disposals (128,606) – (128,606) – (128,606)<br />
Reclassifications/adjustments (Note 7) 890,228 – 890,228 – 890,228<br />
At December 31 8,362,110 28,381 8,390,491 327,125 8,717,616<br />
Accumulated Depreciation and<br />
Amortization<br />
At January 1 4,795,295 8,514 4,803,809 – 4,803,809<br />
Amortization 740,819 5,676 746,495 – 746,495<br />
Retirements/disposals (120,561) – (120,561) – (120,561)<br />
Reclassifications/adjustments (Note 7) 34,176 – 34,176 – 34,176<br />
At December 31 5,449,729 14,190 5,463,919 – 5,463,919<br />
Impairment Losses<br />
At January 1 – – – – –<br />
Additions 5,321 – 5,321 – 5,321<br />
At December 31 5,321 – 5,321 – 5,321<br />
Net Book Value at December 31 P=2,907,060 P=14,191 P=2,921,251 P=327,125 P=3,248,376<br />
In the first quarter of 2012, the EUL of certain wireless and wireline licenses were changed as a result of<br />
continuing upgrade and migration to a modernized network. The net effect of the change in EUL resulted to<br />
higher amortization expense of P=835.17 million for the year ended December 31, 2012.<br />
172 173