here - Ayala
here - Ayala
here - Ayala

Create successful ePaper yourself
Turn your PDF publications into a flip-book with our unique Google optimized e-Paper software.
Globe 2012 annual report<br />
financial report<br />
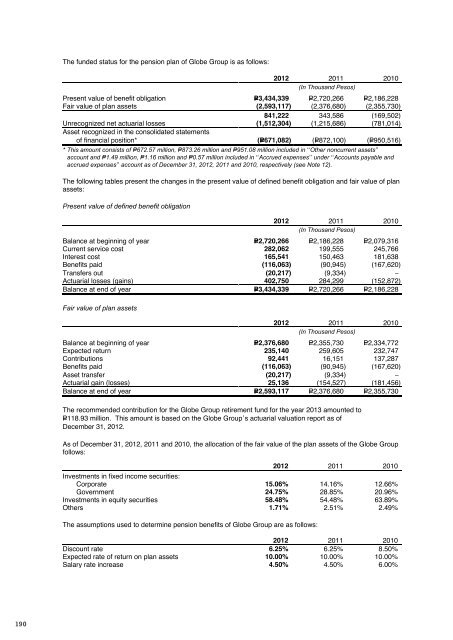
The funded status for the pension plan of Globe Group is as follows:<br />
2012 2011 2010<br />
(In Thousand Pesos)<br />
Present value of benefit obligation P=3,434,339 P=2,720,266 P=2,186,228<br />
Fair value of plan assets (2,593,117) (2,376,680) (2,355,730)<br />
841,222 343,586 (169,502)<br />
Unrecognized net actuarial losses (1,512,304) (1,215,686) (781,014)<br />
Asset recognized in the consolidated statements<br />
of financial position* (P=671,082) (P=872,100) (P=950,516)<br />
* This amount consists of P=672.57 million, P=873.26 million and P=951.08 million included in “Other noncurrent assets”<br />
account and P=1.49 million, P=1.16 million and P=0.57 million included in “Accrued expenses” under “Accounts payable and<br />
accrued expenses” account as of December 31, 2012, 2011 and 2010, respectively (see Note 12).<br />
The following tables present the changes in the present value of defined benefit obligation and fair value of plan<br />
assets:<br />
Present value of defined benefit obligation<br />
2012 2011 2010<br />
(In Thousand Pesos)<br />
Balance at beginning of year P=2,720,266 P=2,186,228 P=2,079,316<br />
Current service cost 282,062 199,555 245,766<br />
Interest cost 165,541 150,463 181,638<br />
Benefits paid (116,063) (90,945) (167,620)<br />
Transfers out (20,217) (9,334) –<br />
Actuarial losses (gains) 402,750 284,299 (152,872)<br />
Balance at end of year P=3,434,339 P=2,720,266 P=2,186,228<br />
Fair value of plan assets<br />
2012 2011 2010<br />
(In Thousand Pesos)<br />
Balance at beginning of year P=2,376,680 P=2,355,730 P=2,334,772<br />
Expected return 235,140 259,605 232,747<br />
Contributions 92,441 16,151 137,287<br />
Benefits paid (116,063) (90,945) (167,620)<br />
Asset transfer (20,217) (9,334) –<br />
Actuarial gain (losses) 25,136 (154,527) (181,456)<br />
Balance at end of year P=2,593,117 P=2,376,680 P=2,355,730<br />
The recommended contribution for the Globe Group retirement fund for the year 2013 amounted to<br />
P=118.93 million. This amount is based on the Globe Group’s actuarial valuation report as of<br />
December 31, 2012.<br />
As of December 31, 2012, 2011 and 2010, the allocation of the fair value of the plan assets of the Globe Group<br />
follows:<br />
2012 2011 2010<br />
Investments in fixed income securities:<br />
Corporate 15.06% 14.16% 12.66%<br />
Government 24.75% 28.85% 20.96%<br />
Investments in equity securities 58.48% 54.48% 63.89%<br />
Others 1.71% 2.51% 2.49%<br />
The assumptions used to determine pension benefits of Globe Group are as follows:<br />
2012 2011 2010<br />
Discount rate 6.25% 6.25% 8.50%<br />
Expected rate of return on plan assets 10.00% 10.00% 10.00%<br />
Salary rate increase 4.50% 4.50% 6.00%<br />
In 2012, 2011 and 2010, the Globe Group applied a single weighted average discount rate that reflects the<br />
estimated timing and amount of benefit payments.<br />
The overall expected rate of return on plan assets is determined based on the market prices prevailing on that<br />
date, applicable to the period over which the obligation is to be settled.<br />
Amounts for the current and previous four years are as follows:<br />
2012 2011 2010 2009 2008<br />
(In Thousand Pesos)<br />
Present value of defined benefit<br />
obligation P=3,434,339 P=2,720,266 P=2,186,228 P=2,079,316 P=1,319,742<br />
Fair value of plan assets 2,593,117 2,376,680 2,355,730 2,334,772 2,344,764<br />
Deficit (surplus) 841,222 343,586 (169,502) (255,456) (1,025,022)<br />
Experience adjustments:<br />
Gain (loss) on plan liabilities (P=89,538) P=343,102 (P=23,901) P=18,390 (P=51,340)<br />
Gain (loss) on plan assets 25,136 (154,527) (181,456) (114,327) (272,539)<br />
19. Interest Income<br />
Interest income is earned from the following sources:<br />
Notes 2012 2011 2010<br />
(In Thousand Pesos)<br />
Short-term placements 30 P=316,894 P=188,557 P=90,889<br />
Cash in banks 30 17,097 8,025 23,121<br />
Loans receivable 11, 16.3<br />
BTI 138,385 – –<br />
GGRP 76,273 76,056 78,766<br />
BHI 24,818 24,750 25,756<br />
Others 6,384 – –<br />
P=579,851 P=297,388 P=218,532<br />
20. Other Income<br />
This account consists of:<br />
Notes 2012 2011 2010<br />
(In Thousand Pesos)<br />
Foreign exchange gain - net 22, 28.2.1.2 P=318,334 P=– P=465,373<br />
Lease income 25.4, 25.1.b 172,499 172,499 P=173,261<br />
Gain on derivative instruments 28 – 25,495 –<br />
Others 225,538 376,774 218,307<br />
P=716,371 P=574,768 P=856,941<br />
The peso to US dollar exchange rates amounted to P=41.078, P=43.919 and P=43.811 as of December 31, 2012,<br />
2011 and 2010, respectively.<br />
In 2011, net foreign exchange loss amounting to P=308.65 million was presented as part of “Financing costs”<br />
account in the consolidated statements of comprehensive income (see Note 22).<br />
The Globe Group’s net foreign currency-denominated liabilities amounted to USD161.22 million,<br />
USD188.97 million and USD267.77 million as of December 31, 2012, 2011 and 2010, respectively<br />
(see Note 28.2.1.2).<br />
190 191