here - Ayala
here - Ayala
here - Ayala

Create successful ePaper yourself
Turn your PDF publications into a flip-book with our unique Google optimized e-Paper software.
Globe 2012 annual report<br />
financial report<br />
Group basis. For its investments with banks, the Globe Group has a counterparty risk management policy<br />
which allocates investment limits based on counterparty credit rating and credit risk profile.<br />
The Globe Group makes a quarterly assessment of the credit standing of its investment counterparties, and<br />
allocates investment limits based on size, liquidity, profitability, and asset quality. For investments in<br />
government securities, these are denominated in local currency and are considered to be relatively riskfree.<br />
The usage of limits is regularly monitored. For its derivative counterparties, the Globe Group deals<br />
only with counterparty banks with investment grade ratings and large local banks. Credit ratings of<br />
derivative counterparties are reviewed quarterly.<br />
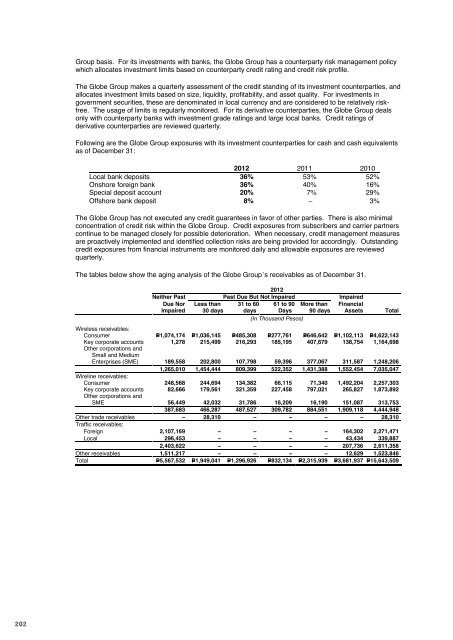
Following are the Globe Group exposures with its investment counterparties for cash and cash equivalents<br />
as of December 31:<br />
2012 2011 2010<br />
Local bank deposits 36% 53% 52%<br />
Onshore foreign bank 36% 40% 16%<br />
Special deposit account 20% 7% 29%<br />
Offshore bank deposit 8% – 3%<br />
The Globe Group has not executed any credit guarantees in favor of other parties. T<strong>here</strong> is also minimal<br />
concentration of credit risk within the Globe Group. Credit exposures from subscribers and carrier partners<br />
continue to be managed closely for possible deterioration. When necessary, credit management measures<br />
are proactively implemented and identified collection risks are being provided for accordingly. Outstanding<br />
credit exposures from financial instruments are monitored daily and allowable exposures are reviewed<br />
quarterly.<br />
The tables below show the aging analysis of the Globe Group’s receivables as of December 31.<br />
2012<br />
Neither Past Past Due But Not Impaired Impaired<br />
Due Nor Less than 31 to 60 61 to 90 More than Financial<br />
Impaired 30 days days Days 90 days Assets Total<br />
(In Thousand Pesos)<br />
Wireless receivables:<br />
Consumer P=1,074,174 P=1,036,145 P=485,308 P=277,761 P=646,642 P=1,102,113 P=4,622,143<br />
Key corporate accounts 1,278 215,499 216,293 185,195 407,679 138,754 1,164,698<br />
Other corporations and<br />
Small and Medium<br />
Enterprises (SME) 189,558 202,800 107,798 59,396 377,067 311,587 1,248,206<br />
1,265,010 1,454,444 809,399 522,352 1,431,388 1,552,454 7,035,047<br />
Wireline receivables:<br />
Consumer 248,568 244,694 134,382 66,115 71,340 1,492,204 2,257,303<br />
Key corporate accounts 82,666 179,561 321,359 227,458 797,021 265,827 1,873,892<br />
Other corporations and<br />
SME 56,449 42,032 31,786 16,209 16,190 151,087 313,753<br />
387,683 466,287 487,527 309,782 884,551 1,909,118 4,444,948<br />
Other trade receivables – 28,310 – – – – 28,310<br />
Traffic receivables:<br />
Foreign 2,107,169 – – – – 164,302 2,271,471<br />
Local 296,453 – – – – 43,434 339,887<br />
2,403,622 – – – – 207,736 2,611,358<br />
Other receivables 1,511,217 – – – – 12,629 1,523,846<br />
Total P=5,567,532 P=1,949,041 P=1,296,926 P=832,134 P=2,315,939 P=3,681,937 P=15,643,509<br />
2011<br />
Neither Past Past Due But Not Impaired Impaired<br />
Due Nor Less than 31 to 60 61 to 90 More than Financial<br />
Impaired 30 days days Days 90 days Assets Total<br />
(In Thousand Pesos)<br />
Wireless receivables:<br />
Consumer P=668,475 P=651,816 P=381,531 P=227,761 P=538,984 P=713,729 P=3,182,296<br />
Key corporate accounts 51,246 169,990 201,517 132,861 326,724 81,418 963,756<br />
Other corporations and<br />
SME 288,812 254,929 250,509 137,686 436,163 161,668 1,529,767<br />
1,008,533 1,076,735 833,557 498,308 1,301,871 956,815 5,675,819<br />
Wireline receivables:<br />
Consumer 241,871 240,349 117,342 57,601 50,462 1,782,483 2,490,108<br />
Key corporate accounts 54,660 160,792 310,180 205,290 676,864 214,751 1,622,537<br />
Other corporations and<br />
SME 62,354 82,425 31,998 24,815 41,776 192,679 436,047<br />
358,885 483,566 459,520 287,706 769,102 2,189,913 4,548,692<br />
Other trade receivables – 3,986 1,940 5,553 9,278 – 20,757<br />
Traffic receivables:<br />
Foreign 1,890,996 – – – – 165,261 2,056,257<br />
Local 163,068 – – – – 72,537 235,605<br />
2,054,064 – – – – 237,798 2,291,862<br />
Other receivables 951,302 – – – – 11,703 963,005<br />
Total P=4,372,784 P=1,564,287 P=1,295,017 P=791,567 P=2,080,251 P=3,396,229 P=13,500,135<br />
2010<br />
Neither Past Past Due But Not Impaired Impaired<br />
Due Nor Less than 31 to 60 61 to 90 More than Financial<br />
Impaired 30 days days Days 90 days Assets Total<br />
(In Thousand Pesos)<br />
Wireless receivables:<br />
Consumer P=521,771 P=739,554 P=311,860 P=139,330 P=744,827 P=346,499 P=2,803,841<br />
Key corporate accounts 19,975 103,032 150,689 127,929 201,733 74,131 677,489<br />
Other corporations and<br />
SME 129,570 152,544 76,092 18,802 175,710 83,920 636,638<br />
671,316 995,130 538,641 286,061 1,122,270 504,550 4,117,968<br />
Wireline receivables:<br />
Consumer 235,480 215,510 111,297 66,806 76,989 1,252,527 1,958,609<br />
Key corporate accounts 11,998 166,530 154,248 207,756 813,507 179,015 1,533,054<br />
Other corporations and<br />
SME 77,937 66,958 41,847 24,945 58,744 140,542 410,973<br />
325,415 448,998 307,392 299,507 949,240 1,572,084 3,902,636<br />
Other trade receivables – – 8,447 5,186 4,214 17,847<br />
Traffic receivables:<br />
Foreign 1,731,708 – – – – 175,241 1,906,949<br />
Local 133,474 – – – – 89,815 223,289<br />
1,865,182 – – – – 265,056 2,130,238<br />
Other receivables 647,464 – – – – 11,414 658,878<br />
Total P=3,509,377 P=1,444,128 P=854,480 P=590,754 P=2,075,724 P=2,353,104 P=10,827,567<br />
Total allowance for impairment losses amounted to P=3,538.07 million, P=3,380.63 million and P=2,453.44<br />
million includes allowance for impairment losses arising from specific and collective assessment amounted<br />
to P=341.73 million, P=337.65 million and P=328.72 million as of December 31, 2012, 2011 and 2010,<br />
respectively (see Note 4).<br />
202 203