Attachments - City of Busselton
Attachments - City of Busselton
Attachments - City of Busselton

Create successful ePaper yourself
Turn your PDF publications into a flip-book with our unique Google optimized e-Paper software.
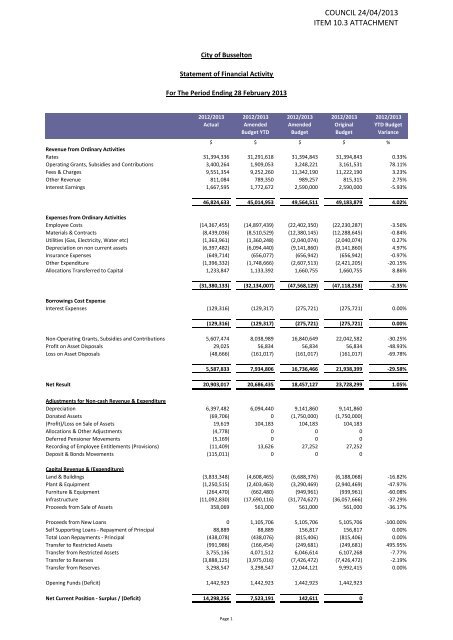
COUNCIL 24/04/2013<br />
ITEM 10.3 ATTACHMENT<br />
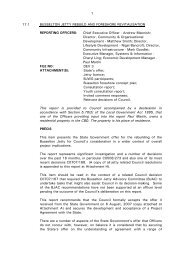
<strong>City</strong> <strong>of</strong> <strong>Busselton</strong><br />
Statement <strong>of</strong> Financial Activity<br />
For The Period Ending 28 February 2013<br />
2012/2013 2012/2013 2012/2013 2012/2013 2012/2013<br />
Actual Amended Amended Original YTD Budget<br />
Budget YTD Budget<br />
Budget Variance<br />
$ $ $ $ %<br />
Revenue from Ordinary Activities<br />
Rates 31,394,336 31,291,618 31,394,843 31,394,843 0.33%<br />
Operating Grants, Subsidies and Contributions 3,400,264 1,909,053 3,248,221 3,161,531 78.11%<br />
Fees & Charges 9,551,354 9,252,260 11,342,190 11,222,190 3.23%<br />
Other Revenue 811,084 789,350 989,257 815,315 2.75%<br />
Interest Earnings 1,667,595 1,772,672 2,590,000 2,590,000 -5.93%<br />
46,824,633 45,014,953 49,564,511 49,183,879 4.02%<br />
Expenses from Ordinary Activities<br />
Employee Costs (14,367,455) (14,897,439) (22,402,350) (22,230,287) -3.56%<br />
Materials & Contracts (8,439,036) (8,510,529) (12,380,145) (12,288,645) -0.84%<br />
Utilities (Gas, Electricity, Water etc) (1,363,961) (1,360,248) (2,040,074) (2,040,074) 0.27%<br />
Depreciation on non current assets (6,397,482) (6,094,440) (9,141,860) (9,141,860) 4.97%<br />
Insurance Expenses (649,714) (656,077) (656,942) (656,942) -0.97%<br />
Other Expenditure (1,396,332) (1,748,666) (2,607,513) (2,421,205) -20.15%<br />
Allocations Transferred to Capital 1,233,847 1,133,392 1,660,755 1,660,755 8.86%<br />
(31,380,133) (32,134,007) (47,568,129) (47,118,258) -2.35%<br />
Borrowings Cost Expense<br />
Interest Expenses (129,316) (129,317) (275,721) (275,721) 0.00%<br />
(129,316) (129,317) (275,721) (275,721) 0.00%<br />
Non-Operating Grants, Subsidies and Contributions 5,607,474 8,038,989 16,840,649 22,042,582 -30.25%<br />
Pr<strong>of</strong>it on Asset Disposals 29,025 56,834 56,834 56,834 -48.93%<br />
Loss on Asset Disposals (48,666) (161,017) (161,017) (161,017) -69.78%<br />
5,587,833 7,934,806 16,736,466 21,938,399 -29.58%<br />
Net Result 20,903,017 20,686,435 18,457,127 23,728,299 1.05%<br />
Adjustments for Non-cash Revenue & Expenditure<br />
Depreciation 6,397,482 6,094,440 9,141,860 9,141,860<br />
Donated Assets (69,706) 0 (1,750,000) (1,750,000)<br />
(Pr<strong>of</strong>it)/Loss on Sale <strong>of</strong> Assets 19,619 104,183 104,183 104,183<br />
Allocations & Other Adjustments (4,778) 0 0 0<br />
Deferred Pensioner Movements (5,169) 0 0 0<br />
Recording <strong>of</strong> Employee Entitlements (Provisions) (11,409) 13,626 27,252 27,252<br />
Deposit & Bonds Movements (115,011) 0 0 0<br />
Capital Revenue & (Expenditure)<br />
Land & Buildings (3,833,348) (4,608,465) (6,688,376) (6,188,068) -16.82%<br />
Plant & Equipment (1,250,515) (2,403,463) (3,290,469) (2,940,469) -47.97%<br />
Furniture & Equipment (264,470) (662,480) (949,961) (939,961) -60.08%<br />
Infrastructure (11,092,830) (17,690,116) (31,774,627) (36,057,666) -37.29%<br />
Proceeds from Sale <strong>of</strong> Assets 358,069 561,000 561,000 561,000 -36.17%<br />
Proceeds from New Loans 0 1,105,706 5,105,706 5,105,706 -100.00%<br />
Self Supporting Loans - Repayment <strong>of</strong> Principal 88,889 88,889 156,817 156,817 0.00%<br />
Total Loan Repayments - Principal (438,078) (438,076) (815,406) (815,406) 0.00%<br />
Transfer to Restricted Assets (991,986) (166,454) (249,681) (249,681) 495.95%<br />
Transfer from Restricted Assets 3,755,136 4,071,512 6,046,614 6,107,268 -7.77%<br />
Transfer to Reserves (3,888,125) (3,975,016) (7,426,472) (7,426,472) -2.19%<br />
Transfer from Reserves 3,298,547 3,298,547 12,044,121 9,992,415 0.00%<br />
Opening Funds (Deficit) 1,442,923 1,442,923 1,442,923 1,442,923<br />
Net Current Position - Surplus / (Deficit) 14,298,256 7,523,191 142,611 0<br />
Page 1