Pano System for Cloud Administrator's Guide - Pano Logic
Pano System for Cloud Administrator's Guide - Pano Logic
Pano System for Cloud Administrator's Guide - Pano Logic

Create successful ePaper yourself
Turn your PDF publications into a flip-book with our unique Google optimized e-Paper software.
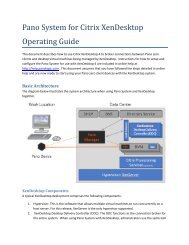
Chrome Task Manager<br />
To check on detailed resource use on an<br />
individual <strong>Pano</strong> Desktop <strong>for</strong> <strong>Cloud</strong>, you can<br />
right-click in Chrome’s tab bar and select<br />
Task Manager, or type Shift-Esc. Using the<br />
Chrome Task Manager requires more ef<strong>for</strong>t<br />
than using a server-based tool but it also<br />
provides a wealth of detail on exactly how<br />
much resources are used by each tab,<br />
extension, or website rather than just<br />
providing an overall number per desktop.<br />
When opened, the Chrome Task Manager will<br />
display a list of all of the processes running<br />
on the cloud desktop, including memory<br />
used, CPU percentage, transfer speed over<br />
the network, and the frames per second (FPS) where applicable. The in<strong>for</strong>mation listed <strong>for</strong> each<br />
task will be dynamically updated in the Task Manager as task resource needs change.<br />
You can use the Task Manager inside a <strong>Pano</strong> Desktop <strong>for</strong> <strong>Cloud</strong> that is experiencing per<strong>for</strong>mance<br />
problems to pin down with tab, application, or browser extension might be consuming excessive<br />
resources. Click on any of the column labels to have the results sorted by the values in that<br />
column - <strong>for</strong> example, to look at the tasks that are using the most RAM, click on the ‘Memory’<br />
column heading to re-sort the results by amount of memory used.<br />
To get more detailed in<strong>for</strong>mation, click on the ‘Stats <strong>for</strong> nerds’ link in the lower-left corner of the<br />
Chrome Task Manager. This will open a browser tab with more detailed figures on memory usage<br />
and provide a total <strong>for</strong> the browser.<br />
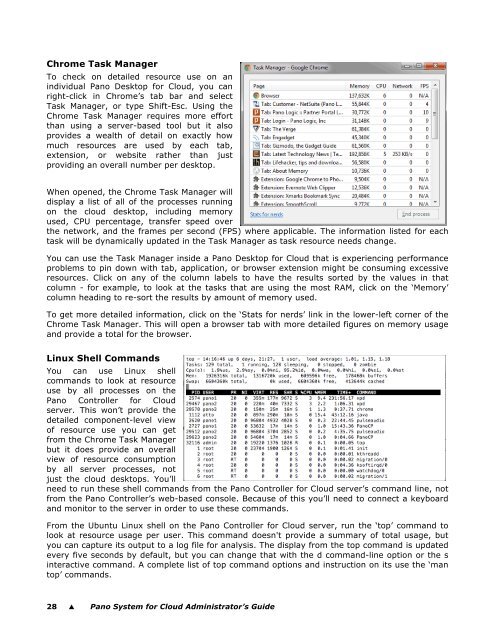
Linux Shell Commands<br />
You can use Linux shell<br />
commands to look at resource<br />
use by all processes on the<br />
<strong>Pano</strong> Controller <strong>for</strong> <strong>Cloud</strong><br />
server. This won’t provide the<br />
detailed component-level view<br />
of resource use you can get<br />
from the Chrome Task Manager<br />
but it does provide an overall<br />
view of resource consumption<br />
by all server processes, not<br />
just the cloud desktops. You’ll<br />
need to run these shell commands from the <strong>Pano</strong> Controller <strong>for</strong> <strong>Cloud</strong> server’s command line, not<br />
from the <strong>Pano</strong> Controller’s web-based console. Because of this you’ll need to connect a keyboard<br />
and monitor to the server in order to use these commands.<br />
From the Ubuntu Linux shell on the <strong>Pano</strong> Controller <strong>for</strong> <strong>Cloud</strong> server, run the ‘top’ command to<br />
look at resource usage per user. This command doesn't provide a summary of total usage, but<br />
you can capture its output to a log file <strong>for</strong> analysis. The display from the top command is updated<br />
every five seconds by default, but you can change that with the d command-line option or the s<br />
interactive command. A complete list of top command options and instruction on its use the ‘man<br />
top’ commands.<br />
28 � <strong>Pano</strong> <strong>System</strong> <strong>for</strong> <strong>Cloud</strong> Administrator’s <strong>Guide</strong>