TGQR 2010Q4 Report.pdf - Teragridforum.org
TGQR 2010Q4 Report.pdf - Teragridforum.org
TGQR 2010Q4 Report.pdf - Teragridforum.org

Create successful ePaper yourself
Turn your PDF publications into a flip-book with our unique Google optimized e-Paper software.
2.1.18<br />
2.1.19<br />
Physics: The Geophysical High Order Suite for Turbulence (GHOST) (PI: Annick<br />
Pouquet, NCAR)<br />
Student Training: Use of TeraGrid Systems in the Classroom and Research Lab (PI:<br />
Andrew Ruether, Swarthmore College)<br />
2.2 Science and Engineering Highlights<br />
2.2.1<br />
Astronomical Sciences: Detecting HI In Emission At z = 1: The Effect of Substructure<br />
(PI: Tiziana Di Matteo, Carnegie Mellon)<br />
Observations show that the cosmic star formation rate has declined by more than one order of<br />
magnitude since redshift z = 1 (about 7.7 billion years ago). However a combined census of the<br />
cold gas (the fuel for star formation), and stellar components is largely missing in observations.<br />
This cold gas fraction is a crucial ingredient in models of galaxy formation and will suggest how<br />
galaxies obtain gas and subsequently convert it to stars. A census of neutral hydrogen (HI) will<br />
put tight constraints on different models of galaxy formation.<br />
Based on current observations, Di Matteo’s group modeled the distribution of HI using dark<br />
matter simulations with 14.6 billion particles at z = 1, using the hybrid MPI/Pthreads and<br />
massively parallel code GADGET on ~22k cores of TeraGrid’s Kraken system at NICS. This<br />
simulation is around 1.5 times larger than the Millennium Simulation (Springel et al. 2005) with 3<br />
times finer mass resolution. This was made possible by their NSF PetaApps project with PSC and<br />
the University of Washington, which has scaled GADGET to ~100k cores on Kraken.<br />
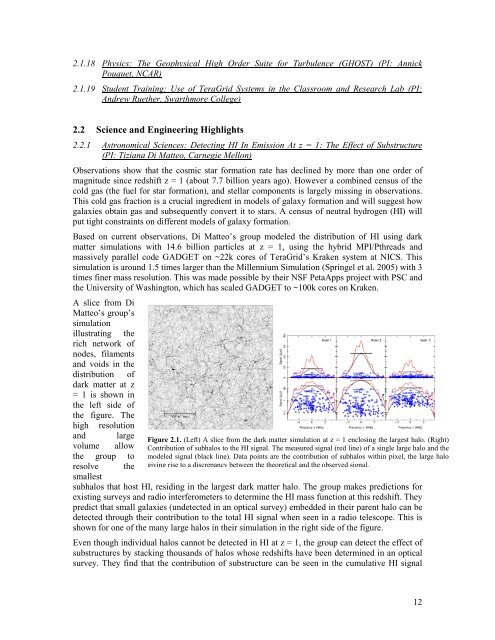
A slice from Di<br />
Matteo’s group’s<br />
simulation<br />
illustrating the<br />
rich network of<br />
nodes, filaments<br />
and voids in the<br />
distribution of<br />
dark matter at z<br />
= 1 is shown in<br />
the left side of<br />
the figure. The<br />
high resolution<br />
and large<br />
volume allow<br />
the group to<br />
resolve the<br />
smallest<br />
subhalos that host HI, residing in the largest dark matter halo. The group makes predictions for<br />
existing surveys and radio interferometers to determine the HI mass function at this redshift. They<br />
predict that small galaxies (undetected in an optical survey) embedded in their parent halo can be<br />
detected through their contribution to the total HI signal when seen in a radio telescope. This is<br />
shown for one of the many large halos in their simulation in the right side of the figure.<br />
Figure 2.1. (Left) A slice from the dark matter simulation at z = 1 enclosing the largest halo. (Right)<br />
Contribution of subhalos to the HI signal. The measured signal (red line) of a single large halo and the<br />
modeled signal (black line). Data points are the contribution of subhalos within pixel, the large halo<br />
giving rise to a discrepancy between the theoretical and the observed signal.<br />
Even though individual halos cannot be detected in HI at z = 1, the group can detect the effect of<br />
substructures by stacking thousands of halos whose redshifts have been determined in an optical<br />
survey. They find that the contribution of substructure can be seen in the cumulative HI signal<br />
12