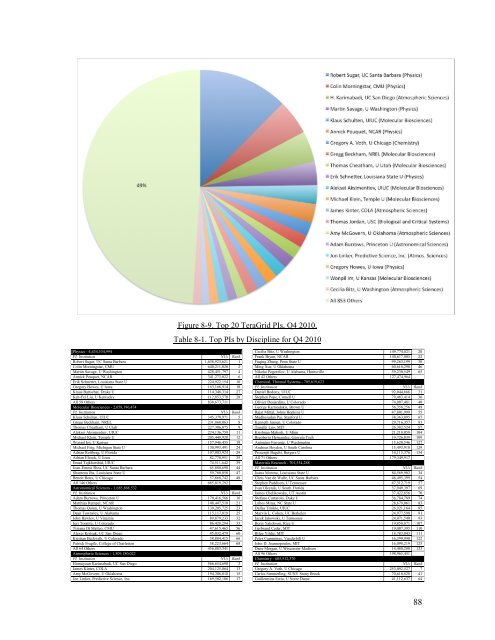
Figure 8-9. Top 20 TeraGrid PIs, Q4 2010. Table 8-1. Top PIs by Discipline for Q4 2010 Physics - 4,434,534,994 PI, Institution NUs Rank Robert Sugar, UC Santa Barbara 1,638,923,621 1 Colin Morningstar, CMU 640,211,020 2 Martin Savage, U Washington 428,451,797 4 Annick Pouquet, NCAR 341,273,022 6 Erik Schnetter, Louisiana State U 224,922,154 10 Gregory Howes, U Iowa 163,168,914 18 Klaus Bartschat, Drake U 114,348,314 27 Keh-Fei Liu, U Kentucky 112,853,570 28 All 58 Others 838,673,711 Molecular Biosciences - 2,658,196,474 PI, Institution NUs Rank Klaus Schulten, UIUC 345,370,971 5 Gregg Beckham, NREL 231,860,063 8 Thomas Cheatham, U Utah 227,306,075 9 Aleksei Aksimentiev, UIUC 224,136,759 11 Michael Klein, Temple U 205,449,920 12 Wonpil Im, U Kansas 157,946,455 19 Michael Feig, Michigan State U 130,993,491 24 Adrian Roitberg, U Florida 107,003,924 29 Adrian Elcock, U Iowa 82,770,951 35 Emad Tajkhorshid, UIUC 74,511,642 39 Joan-Emma Shea, UC Santa Barbara 65,880,698 44 Shantenu Jha, Louisiana State U 59,760,050 47 Benoit Roux, U Chicago 57,868,742 48 All 146 Others 685,819,292 Astronomical Sciences - 1,685,868,532 PI, Institution NUs Rank Adam Burrows, Princeton U 170,416,566 16 Matthias Rempel, NCAR 148,447,510 21 Thomas Quinn, U Washington 139,205,725 23 Dean Townsley, U Alabama 115,117,819 25 John Hawley, U Virginia 89,879,233 32 Juri Toomre, U Colorado 86,428,294 33 Tiziana Di Matteo, CMU 47,615,465 56 Alexei Kritsuk, UC San Diego 45,032,479 60 Kristian Beckwith, U Colorado 38,884,415 66 Patrick Fragile, College of Charleston 38,223,664 68 All 64 Others 456,883,341 Atmospheric Sciences - 1,509,180,022 PI, Institution NUs Rank Homayoun Karimabadi, UC San Diego 566,654,690 3 James Kinter, COLA 204,125,064 13 Amy McGovern, U Oklahoma 194,388,010 15 Jon Linker, Predictive Science, Inc. 169,502,106 17 Cecilia Bitz, U Washington 149,774,821 20 Frank Bryan, NCAR 140,617,805 22 Fuqing Zhang, Penn State U 99,263,199 30 Ming Xue, U Oklahoma 60,618,290 46 Nikolai Pogorelov, U Alabama, Huntsville 39,230,549 65 All 42 Others 127,474,964 Chemical, Thermal Systems - 705,619,623 PI, Institution NUs Rank Daniel Bodony, UIUC 92,044,666 31 Stephen Pope, Cornell U 79,483,414 36 Olivier Desjardins, U Colorado 74,007,481 40 Ge<strong>org</strong>e Karniadakis, Brown U 56,358,256 49 Rajat Mittal, Johns Hopkins U 47,801,999 55 Madhusudan Pai, Stanford U 38,363,095 67 Kenneth Jansen, U Colorado 29,716,357 81 Tengfei Luo, MIT 26,382,524 87 Krishnan Mahesh, U Minn 21,218,059 104 Rigoberto Hernandez, Ge<strong>org</strong>ia Tech 19,726,039 109 Antonino Ferrante, U Washington 15,620,546 127 Andreas Heyden, U South Carolina 15,493,910 129 Prosenjit Bagchi, Rutgers U 14,115,376 134 All 71 Others 179,349,917 Materials Research - 701,534,288 PI, Institution NUs Rank Juana Moreno, Louisiana State U 84,569,902 34 Chris Van de Walle, UC Santa Barbara 48,495,399 54 Stephen Paddison, U Tennessee 47,312,719 57 Ivan Oleynik, U South Florida 37,949,397 69 James Chelikowsky, UT Austin 37,422,656 70 Stefano Curtarolo, Duke U 36,784,789 74 Lubos Mitas, NC State U 28,679,061 83 Dallas Trinkle, UIUC 26,921,164 85 Marvin L. Cohen, UC Berkeley 24,977,598 91 Jacek Jakowski, U Tennessee 24,071,540 93 Boris Yakobson, Rice U 19,850,871 107 Gerbrand Ceder, MIT 19,007,395 110 Bilge Yildiz, MIT 18,783,043 111 Peter Cummings, Vanderbilt U 16,399,990 122 John D. Joannopoulos, MIT 16,098,219 125 Dane M<strong>org</strong>an, U Wisconsin-Madison 14,480,280 133 All 96 Others 198,965,451 Chemistry - 605,512,370 PI, Institution NUs Rank Gregory A. Voth, U Chicago 253,092,527 7 Carlos Simmerling, SUNY Stony Brook 70,610,828 41 Guillermina Estiu, U Notre Dame 41,112,637 64 88
Arun Yethiraj, U Wisconsin-Madison 22,711,862 97 B. Montgomery Pettitt, U Houston 21,431,386 101 Kendall N. Houk, UCLA 15,505,351 128 Jennifer Wilcox, Stanford U 14,050,308 135 All 123 Others 166,707,676 Advanced Scientific Computing - 229,391,250 PI, Institution NUs Rank Ali Uzun, Florida State U 115,023,030 26 Bruce Boghosian, Tufts U 50,598,758 52 Stefan Boeriu, UC Santa Barbara 21,263,524 103 Martin Berzins, U Utah 12,905,492 142 Xiaowen Wang, UCLA 8,646,245 183 Richard Loft, NCAR 8,094,723 188 All 33 Others 12,438,757 Biological and Critical Systems - 217,030,681 PI, Institution NUs Rank Thomas Jordan, USC 203,515,374 14 Tony Keaveny, UC Berkeley 10,012,261 160 All 3 Others 949,158 All Others - 471,977,749 8.10.4 Usage by Institution PI, Institution (Discipline) NUs Rank Mark Miller, SDSC (Environmental Biology) 43,578,333 62 Clinton N. Dawson, UT Austin (Mathematical Sciences) 37,173,926 71 Narayana Aluru, UIUC (Cross-Disciplinary Activities) 36,860,594 72 Leung Tsang, U Washington (Earth Sciences) 34,595,141 76 Omar Ghattas, UT Austin (Earth Sciences) 32,853,585 78 Baylor Fox-Kemper, U Colorado (Ocean Sciences) 25,077,517 90 M<strong>org</strong>an Moschetti, USGS (Earth Sciences) 16,987,228 119 Alexa Griesel, SIO (Ocean Sciences) 15,990,957 126 Ronald E. Cohen, CIW (Earth Sciences) 12,465,931 143 Shanhui Fan, Stanford U (Electrical and Comm. Systems) 11,473,088 151 Lynn Wright, SURA (Ocean Sciences) 11,179,288 154 Liwen Shih, U Houston-Clear Lake (Computer and Computation Research) 9,800,482 164 All 141 Others 184,399,738 Users from 319 institutions across the U.S. and abroad were associated with the usage delivered by TeraGrid resources. The top 47 institutions (by NUs consumed) were responsible for 80% of the total NUs delivered. Table 8-3 lists the 319 institutions, the number of users responsible for the usage at each site, and the NUs consumed. Table 8-2. TeraGrid Usage by Institution, Q4 2010 Institution Users NUs Indiana U 14 1,209,917,563 UIUC 241 947,274,596 NCAR 18 803,008,614 U Washington 35 773,850,669 Jefferson Lab 1 583,245,165 LANL 9 575,785,646 U Utah 22 379,976,674 BNL 1 326,051,936 U Colorado 47 224,511,529 Princeton U 19 223,859,648 UC San Diego 90 205,965,605 U Chicago 43 187,560,066 U Wisconsin-Madison 41 184,085,630 SUNY Stony Brook 15 177,031,382 NREL 10 170,118,242 U Kansas 15 161,622,666 Louisiana State U 41 159,911,762 U Iowa 16 155,173,281 UC Santa Barbara 45 149,052,069 U Maryland, College Park 25 147,531,049 Atmospheric Tech Services Co. 1 142,054,709 U Arizona 9 136,287,533 Michigan State U 11 135,586,126 Ge<strong>org</strong>ia Tech 39 130,820,561 U Oklahoma 39 129,222,144 Temple U 14 121,647,604 CMU 23 117,688,814 Florida State U 4 115,054,042 U Virginia 19 114,394,924 MIT 40 114,175,543 Arizona State U 14 110,404,033 Caltech 28 110,398,424 Boston U 18 108,077,635 U Florida 23 107,731,519 SDSC 11 107,401,874 Cornell U 36 107,279,390 Penn State U 15 105,150,433 UC Berkeley 49 101,429,549 Predictive Science, Inc. 2 96,627,908 University College, London (United Kingdom) 10 88,686,385 Purdue U 41 83,293,637 UT Arlington 6 82,759,053 Vanderbilt U 13 82,375,139 UNC 11 75,952,289 Stanford U 26 74,903,474 Drake U 2 74,019,013 College of Wm & Mary 6 73,457,068 Brown U 17 69,772,189 Institution Users NUs UT Austin 31 69,228,821 MPI Gravitationsphysik (Germany) 3 68,792,486 Duke U 3 67,436,232 UC Davis 35 66,442,525 U Wyoming 1 63,923,890 Florida Atlantic U 5 61,836,421 Lock Haven U 3 57,808,300 U Tennessee 17 56,636,866 U Rochester 6 53,664,639 UCLA 42 52,849,964 Ge<strong>org</strong>e Washington U 1 52,431,067 Johns Hopkins U 37 52,181,285 U Notre Dame 9 52,088,050 Baylor College of Med 3 50,059,787 Harvard U 16 47,396,464 USC 8 46,285,740 U Pittsburgh 31 45,881,069 RIT 6 45,782,967 Albert Einstein Institute (Germany) 5 45,400,150 Weill Cornell Med College 4 44,136,642 U South Florida 9 44,067,247 UC Irvine 15 40,780,159 U Alabama, Huntsville 7 39,440,356 NYU 13 38,269,787 College of Charleston 4 38,223,664 U Minn 7 33,739,652 Columbia U 19 29,373,799 U Kentucky 5 29,092,242 COLA 2 28,831,540 U Illinois, Chicago 18 28,606,508 U New Hampshire 8 27,452,549 U Michigan 32 25,826,136 SIO 3 24,684,192 Slovak Acad of Sci (Slovakia) 2 24,591,584 Tulane University 5 23,124,481 San Diego State U 6 22,929,779 Drexel U 12 22,909,409 NC Central U 2 21,605,418 Colorado College 1 21,333,888 RPI 8 21,302,205 U Illes Balears (Spain) 1 21,013,662 Duquesne U 7 20,948,678 Texas A&M 6 20,900,934 ANL 2 20,681,907 Inst HEP (China) 1 20,652,667 USGS 2 20,588,221 Rice U 5 20,020,985 NC State U 24 19,046,770 89
- Page 1 and 2:
NSF Extensible Terascale Facility T
- Page 3 and 4:
Working Group Leaders Accounting Ad
- Page 5 and 6:
6.5 RP Operations: Accounting/Core
- Page 7 and 8:
1 Overview The TeraGrid is an open
- Page 9 and 10:
accounting system; an additional 94
- Page 11 and 12:
2 Science and Engineering Highlight
- Page 13 and 14:
and that they will be able to deter
- Page 15 and 16:
Enhancements in photocurrent have b
- Page 17 and 18:
2.2.8 Chemistry: Molecular Simulati
- Page 19 and 20:
to the seafloor. Vortex shedding ca
- Page 21 and 22:
In 2010, Aidun and colleagues made
- Page 23 and 24:
in treating diabetes and obesity. T
- Page 25 and 26:
2.2.18 Physics: The Geophysical Hig
- Page 27 and 28:
service. In addition to GRAM5, we a
- Page 29 and 30:
Figure 4-2 Q4 usage by gateway. The
- Page 31 and 32:
hearing about the experiments, many
- Page 33 and 34:
John Cobb presented the capstone ta
- Page 35 and 36:
Work initiated by a helpdesk ticket
- Page 37 and 38: machine) runs limit use of the syst
- Page 39 and 40: PI Name Joseph Hargitai, Albert Ein
- Page 41 and 42: helped Robert Coridan (UIUC) to exp
- Page 43 and 44: Approach to Physics-based Seismic H
- Page 45 and 46: Helly, SIO/UCSD Lattice Gauge Calcu
- Page 47 and 48: College Simulation and Data Analysi
- Page 49 and 50: During this quarter Cui prepared an
- Page 51 and 52: 7. Minor performance improvements,
- Page 53 and 54: OpenMP. Plan is to continue the eff
- Page 55 and 56: • Joel Ledford of the California
- Page 57 and 58: The team also mentioned that they h
- Page 59 and 60: the makefile for compiling the sour
- Page 61 and 62: Implement test cases for MPI based
- Page 63 and 64: User news was posted to inform the
- Page 65 and 66: authentication infrastructures. Wit
- Page 67 and 68: 6.5 RP Operations: Accounting/Core
- Page 69 and 70: Note that the total repository of T
- Page 71 and 72: From an analysis of the hits for wh
- Page 73 and 74: 7.2 Data 7.2.1 Data Movement contin
- Page 75 and 76: historical time series of average p
- Page 77 and 78: on a demonstration that took place
- Page 79 and 80: NCSA's SGI Altix UV system, Ember,
- Page 81 and 82: 8.5.2 Job Submission (GRAM) Statist
- Page 83 and 84: 8.7 Security 8.7.1 Security Working
- Page 85 and 86: 8.8.4 PSC During October, the PSC s
- Page 87: Figure 8-8. TeraGrid Usage Summary
- Page 91 and 92: Institution Users NUs BRI City of H
- Page 93 and 94: 4. Review Suggested Keywords - TIS
- Page 95 and 96: YNT publications are intended for u
- Page 97 and 98: In response to feedback from the Sc
- Page 99 and 100: Figure 2. XDMoD Portal The 9 Naviga
- Page 101 and 102: Figure 5. Total number of TG jobs r
- Page 103 and 104: Figure 8. Total CPU Consumption per
- Page 105 and 106: Figure 10: XDMoD data warehouse sch
- Page 107 and 108: Figure 12. AMBER-based application
- Page 109 and 110: Dr. Ann Zimmerman of the University
- Page 111 and 112: • Personal utilization informatio
- Page 113 and 114: 2) Given the emergence of Green tec
- Page 115 and 116: supercomputers were a huge draw for
- Page 117 and 118: sciences by enabling and stimulatin
- Page 119 and 120: The TeraGrid booth showcased group
- Page 121 and 122: 10.2 EOT Impact Stories Indiana IU
- Page 123 and 124: The Ranger system at the Texas Adva
- Page 125 and 126: conference to assess their level of
- Page 127 and 128: Also at SC10 Rebecca Day, a teacher
- Page 129 and 130: NCAR For the first time, SIParCS ou
- Page 131 and 132: communicates TeraGrid’s impact. L
- Page 133 and 134: 10/18/2010: TeraGrid Partner SDSC M
- Page 135 and 136: 10.11 Broader Impacts LONI As part
- Page 137 and 138: 14 TeraGrid/Open Science Grid (OSG)
- Page 139 and 140:
• Task I2.1 (Run RAPTOR-OOPS work
- Page 141 and 142:
22. Chourasia, A. 2010. GlyphSea. I
- Page 143 and 144:
A.2. Publications from TeraGrid Use
- Page 145 and 146:
30. Tchekhovskoy, A., Narayan, R.,
- Page 147 and 148:
70. P. M. Motl, J. E. Tohline & J.
- Page 149 and 150:
114. Krolik:Invited talk “Connect
- Page 151 and 152:
142. Houston, A. L. and R. B. Wilhe
- Page 153 and 154:
175. VAN POPPEL, B., DESJARDINS, O.
- Page 155 and 156:
208. J B. Clemens, E. A. Chagarov,
- Page 157 and 158:
238. M.H. Alkordi, A.C. Stern, J.L.
- Page 159 and 160:
DMR050002 272. Unusual dielectric r
- Page 161 and 162:
306. J. Lind, R.M. Suter, “3DXRD
- Page 163 and 164:
348. T.-L. Chan, J.R. Chelikowsky,
- Page 165 and 166:
383. A. Szyperska, J. Rak, J. Leszc
- Page 167 and 168:
416. Armstrong, B. D.; Soto, P.; Sh
- Page 169 and 170:
446. S. A. Shaikh and E. Tajkhorshi
- Page 171 and 172:
483. J´erˆome H´enin, Grace Bran
- Page 173 and 174:
MCB070009 521. J. Lee, S. Ham, and
- Page 175 and 176:
555. Lintao Bu, G.T. Beckham, M.R.
- Page 177 and 178:
Physics MCA06N025 587. “Nuclear P
- Page 179 and 180:
614. Scaling studies of QCD with th
- Page 181 and 182:
PHY060028 645. M. Campanelli, C. O.
- Page 183 and 184:
Astronomical Sciences AST060031 7.
- Page 185 and 186:
47. Reynolds, D. R., Hayes, J. C.,
- Page 187 and 188:
February 17. 91. Liang, X.-Z., 2010
- Page 189 and 190:
123. J.C. Fox, A. Gupta, H.H. Bayra
- Page 191 and 192:
166. Bernard,P.S.,Collins,J.P.andPo
- Page 193 and 194:
Noncolloidal Suspensions,” 7 th I
- Page 195 and 196:
249. V.A. Shubert, C.W. Muller and
- Page 197 and 198:
Motion Simulations in the Central U
- Page 199 and 200:
331. L.K. Wagner and J.C. Grossman.
- Page 201 and 202:
377. Lawrenz, M., Wereszczynski, J.
- Page 203 and 204:
423. C. Maffeo, R. Schopflin, H. Br
- Page 205 and 206:
463. Zhong, L., Walker, R.C., Brady
- Page 207 and 208:
513. McWilliams, J. C., and M. J. M
- Page 209 and 210:
557. Strong-Field Ionization of Lit
- Page 211 and 212:
613. F. Foucart, M. D. Duez, L. E.
- Page 213 and 214:
Seminar What is Cyberinfrastructure
- Page 215 and 216:
P Tour Tech 104 IUPUI, Indianap oli
- Page 217 and 218:
Online Tutorial Parallel Numerical
- Page 219 and 220:
Type Title Location Date(s) Hours N
- Page 221 and 222:
the Classroom Conf. Present‟n Fro
- Page 223 and 224:
m; San Diego, CA Workshop (Teachers
- Page 225 and 226:
Tour Ranger Tour and Cluster Manage
- Page 227 and 228:
Presentation Presentation Extreme-S
- Page 229 and 230:
Work Package Dependencies Planned Q
- Page 231 and 232:
SI.MTS 2.5.10.2 P Metascheduling ca
- Page 233 and 234:
Work Package Dependencies Planned Q
- Page 235 and 236:
Work Package Dependencies Planned Q
- Page 237 and 238:
Project-ID WBS OPMD TeraGrid AUS PY
- Page 239 and 240:
Project-ID WBS OPMD Description Ter
- Page 241 and 242:
Work Package Dependencies Planned R
- Page 243 and 244:
Work Package Dependencies Planned R
- Page 245 and 246:
DV.DC.RP.TACC 3.0.1.22 O TACC RP Da
- Page 247 and 248:
Bennett[30%], ongoing NOS.Sec.RP.PS
- Page 249 and 250:
NOS.INCA 4.4.3.3 P knowledgbase lin
- Page 251 and 252:
QSR 2010Q4 Report Values QSR 2010Q3
- Page 253 and 254:
QSR 2010Q4 Report Values QSR 2010Q3
- Page 255 and 256:
Among the participants were sixty g
- Page 257 and 258:
the talks should address less on th
- Page 259 and 260:
Appendix A - Summer School Agenda M
- Page 261 and 262:
Appendix B - Attendees, Staff and P
- Page 263 and 264:
Staff and Presenters Ferrer Annika