TGQR 2010Q4 Report.pdf - Teragridforum.org
TGQR 2010Q4 Report.pdf - Teragridforum.org
TGQR 2010Q4 Report.pdf - Teragridforum.org

Create successful ePaper yourself
Turn your PDF publications into a flip-book with our unique Google optimized e-Paper software.
team plan to extend these into the two to three hour range. The end goal is to understand how<br />
atmospheric conditions and aircraft types affect the properties of a contrail that are important for<br />
calculating climate impacts.<br />
Their results have been published in Atmospheric Chemistry and Physics in 2010 and also<br />
presented in 2009 at meetings of the American Physical Society Division of Fluid Dynamics and<br />
the American Geophysical Union.<br />
2.2.14<br />
Human Computer Interactions: A Window on the Archives of the Future (PIs: Robert<br />
Chadduck, National Archives and Record Administration; Maria Esteva, and Weijia Xu,<br />
TACC)<br />
With the proliferation of digital records, the task of the archivist<br />
has grown exponentially more complex. This problem is<br />
especially acute for the National Archives and Records<br />
Administration (NARA), the government agency responsible for<br />
managing and preserving the nation’s historical records.<br />
In 2014, NARA expects to receive 8.8 Petabytes (10 15 bites) of<br />
electronic records, bringing their accumulated volume to more<br />
than 35 Petabytes.<br />
To find innovative and scalable solutions to large scale and<br />
heterogeneous electronic records collections, NARA turned to the<br />
TeraGrid and TACC, drawing on the expertise of the center’s<br />
digital archivists and data experts.<br />
Using data from NARA’s Cyberinfrastructure for a Billion<br />
Electronic Records (“CI-BER”) research collaboration, a testbed<br />
of documents collected by NARA, the researchers created a<br />
visualization based on the “treemap” and relational database<br />
systems to represent the collection’s arrangement and to show the<br />
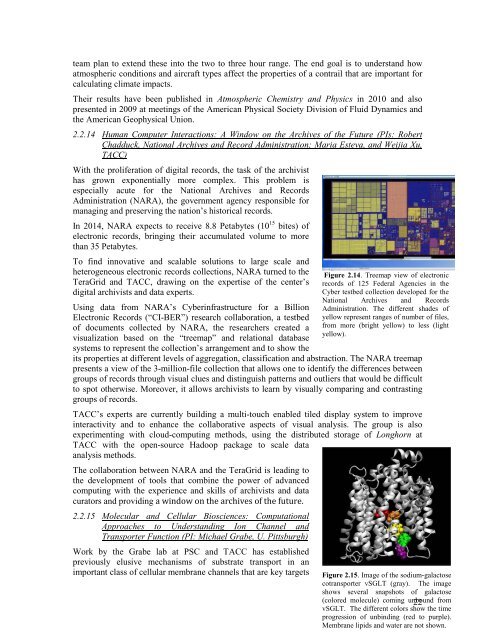
its properties at different levels of aggregation, classification and abstraction. The NARA treemap<br />
presents a view of the 3-million-file collection that allows one to identify the differences between<br />
groups of records through visual clues and distinguish patterns and outliers that would be difficult<br />
to spot otherwise. Moreover, it allows archivists to learn by visually comparing and contrasting<br />
groups of records.<br />
TACC’s experts are currently building a multi-touch enabled tiled display system to improve<br />
interactivity and to enhance the collaborative aspects of visual analysis. The group is also<br />
experimenting with cloud-computing methods, using the distributed storage of Longhorn at<br />
TACC with the open-source Hadoop package to scale data<br />
analysis methods.<br />
The collaboration between NARA and the TeraGrid is leading to<br />
the development of tools that combine the power of advanced<br />
computing with the experience and skills of archivists and data<br />
curators and providing a window on the archives of the future.<br />
2.2.15<br />
Molecular and Cellular Biosciences: Computational<br />
Approaches to Understanding Ion Channel and<br />
Transporter Function (PI: Michael Grabe, U. Pittsburgh)<br />
Work by the Grabe lab at PSC and TACC has established<br />
previously elusive mechanisms of substrate transport in an<br />
important class of cellular membrane channels that are key targets<br />
Figure 2.14. Treemap view of electronic<br />
records of 125 Federal Agencies in the<br />
Cyber testbed collection developed for the<br />
National Archives and Records<br />
Administration. The different shades of<br />
yellow represent ranges of number of files,<br />
from more (bright yellow) to less (light<br />
yellow).<br />
Figure 2.15. Image of the sodium-galactose<br />
cotransporter vSGLT (gray). The image<br />
shows several snapshots of galactose<br />
(colored molecule) coming unbound 22 from<br />
vSGLT. The different colors show the time<br />
progression of unbinding (red to purple).<br />
Membrane lipids and water are not shown.