TGQR 2010Q4 Report.pdf - Teragridforum.org
TGQR 2010Q4 Report.pdf - Teragridforum.org
TGQR 2010Q4 Report.pdf - Teragridforum.org

Create successful ePaper yourself
Turn your PDF publications into a flip-book with our unique Google optimized e-Paper software.
Arun Yethiraj, U Wisconsin-Madison 22,711,862 97<br />
B. Montgomery Pettitt, U Houston 21,431,386 101<br />
Kendall N. Houk, UCLA 15,505,351 128<br />
Jennifer Wilcox, Stanford U 14,050,308 135<br />
All 123 Others 166,707,676<br />
Advanced Scientific Computing - 229,391,250<br />
PI, Institution<br />
NUs Rank<br />
Ali Uzun, Florida State U 115,023,030 26<br />
Bruce Boghosian, Tufts U 50,598,758 52<br />
Stefan Boeriu, UC Santa Barbara 21,263,524 103<br />
Martin Berzins, U Utah 12,905,492 142<br />
Xiaowen Wang, UCLA 8,646,245 183<br />
Richard Loft, NCAR 8,094,723 188<br />
All 33 Others 12,438,757<br />
Biological and Critical Systems - 217,030,681<br />
PI, Institution<br />
NUs Rank<br />
Thomas Jordan, USC 203,515,374 14<br />
Tony Keaveny, UC Berkeley 10,012,261 160<br />
All 3 Others 949,158<br />
All Others - 471,977,749<br />
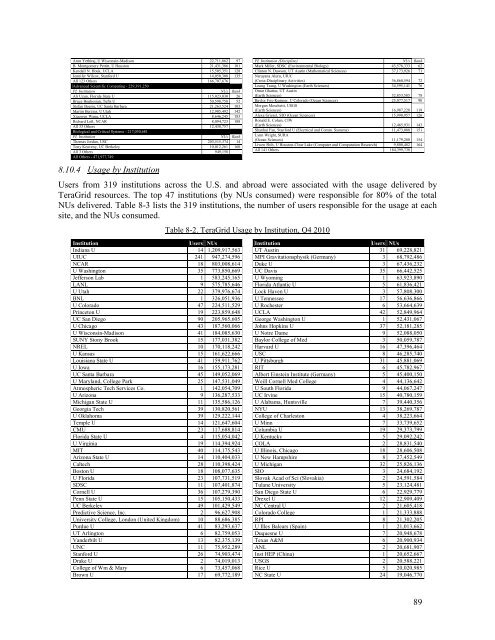
8.10.4 Usage by Institution<br />
PI, Institution (Discipline)<br />
NUs Rank<br />
Mark Miller, SDSC (Environmental Biology) 43,578,333 62<br />
Clinton N. Dawson, UT Austin (Mathematical Sciences) 37,173,926 71<br />
Narayana Aluru, UIUC<br />
(Cross-Disciplinary Activities) 36,860,594 72<br />
Leung Tsang, U Washington (Earth Sciences) 34,595,141 76<br />
Omar Ghattas, UT Austin<br />
(Earth Sciences) 32,853,585 78<br />
Baylor Fox-Kemper, U Colorado (Ocean Sciences) 25,077,517 90<br />
M<strong>org</strong>an Moschetti, USGS<br />
(Earth Sciences) 16,987,228 119<br />
Alexa Griesel, SIO (Ocean Sciences) 15,990,957 126<br />
Ronald E. Cohen, CIW<br />
(Earth Sciences) 12,465,931 143<br />
Shanhui Fan, Stanford U (Electrical and Comm. Systems) 11,473,088 151<br />
Lynn Wright, SURA<br />
(Ocean Sciences) 11,179,288 154<br />
Liwen Shih, U Houston-Clear Lake (Computer and Computation Research) 9,800,482 164<br />
All 141 Others 184,399,738<br />
Users from 319 institutions across the U.S. and abroad were associated with the usage delivered by<br />
TeraGrid resources. The top 47 institutions (by NUs consumed) were responsible for 80% of the total<br />
NUs delivered. Table 8-3 lists the 319 institutions, the number of users responsible for the usage at each<br />
site, and the NUs consumed.<br />
Table 8-2. TeraGrid Usage by Institution, Q4 2010<br />
Institution<br />
Users NUs<br />
Indiana U 14 1,209,917,563<br />
UIUC 241 947,274,596<br />
NCAR 18 803,008,614<br />
U Washington 35 773,850,669<br />
Jefferson Lab 1 583,245,165<br />
LANL 9 575,785,646<br />
U Utah 22 379,976,674<br />
BNL 1 326,051,936<br />
U Colorado 47 224,511,529<br />
Princeton U 19 223,859,648<br />
UC San Diego 90 205,965,605<br />
U Chicago 43 187,560,066<br />
U Wisconsin-Madison 41 184,085,630<br />
SUNY Stony Brook 15 177,031,382<br />
NREL 10 170,118,242<br />
U Kansas 15 161,622,666<br />
Louisiana State U 41 159,911,762<br />
U Iowa 16 155,173,281<br />
UC Santa Barbara 45 149,052,069<br />
U Maryland, College Park 25 147,531,049<br />
Atmospheric Tech Services Co. 1 142,054,709<br />
U Arizona 9 136,287,533<br />
Michigan State U 11 135,586,126<br />
Ge<strong>org</strong>ia Tech 39 130,820,561<br />
U Oklahoma 39 129,222,144<br />
Temple U 14 121,647,604<br />
CMU 23 117,688,814<br />
Florida State U 4 115,054,042<br />
U Virginia 19 114,394,924<br />
MIT 40 114,175,543<br />
Arizona State U 14 110,404,033<br />
Caltech 28 110,398,424<br />
Boston U 18 108,077,635<br />
U Florida 23 107,731,519<br />
SDSC 11 107,401,874<br />
Cornell U 36 107,279,390<br />
Penn State U 15 105,150,433<br />
UC Berkeley 49 101,429,549<br />
Predictive Science, Inc. 2 96,627,908<br />
University College, London (United Kingdom) 10 88,686,385<br />
Purdue U 41 83,293,637<br />
UT Arlington 6 82,759,053<br />
Vanderbilt U 13 82,375,139<br />
UNC 11 75,952,289<br />
Stanford U 26 74,903,474<br />
Drake U 2 74,019,013<br />
College of Wm & Mary 6 73,457,068<br />
Brown U 17 69,772,189<br />
Institution<br />
Users NUs<br />
UT Austin 31 69,228,821<br />
MPI Gravitationsphysik (Germany) 3 68,792,486<br />
Duke U 3 67,436,232<br />
UC Davis 35 66,442,525<br />
U Wyoming 1 63,923,890<br />
Florida Atlantic U 5 61,836,421<br />
Lock Haven U 3 57,808,300<br />
U Tennessee 17 56,636,866<br />
U Rochester 6 53,664,639<br />
UCLA 42 52,849,964<br />
Ge<strong>org</strong>e Washington U 1 52,431,067<br />
Johns Hopkins U 37 52,181,285<br />
U Notre Dame 9 52,088,050<br />
Baylor College of Med 3 50,059,787<br />
Harvard U 16 47,396,464<br />
USC 8 46,285,740<br />
U Pittsburgh 31 45,881,069<br />
RIT 6 45,782,967<br />
Albert Einstein Institute (Germany) 5 45,400,150<br />
Weill Cornell Med College 4 44,136,642<br />
U South Florida 9 44,067,247<br />
UC Irvine 15 40,780,159<br />
U Alabama, Huntsville 7 39,440,356<br />
NYU 13 38,269,787<br />
College of Charleston 4 38,223,664<br />
U Minn 7 33,739,652<br />
Columbia U 19 29,373,799<br />
U Kentucky 5 29,092,242<br />
COLA 2 28,831,540<br />
U Illinois, Chicago 18 28,606,508<br />
U New Hampshire 8 27,452,549<br />
U Michigan 32 25,826,136<br />
SIO 3 24,684,192<br />
Slovak Acad of Sci (Slovakia) 2 24,591,584<br />
Tulane University 5 23,124,481<br />
San Diego State U 6 22,929,779<br />
Drexel U 12 22,909,409<br />
NC Central U 2 21,605,418<br />
Colorado College 1 21,333,888<br />
RPI 8 21,302,205<br />
U Illes Balears (Spain) 1 21,013,662<br />
Duquesne U 7 20,948,678<br />
Texas A&M 6 20,900,934<br />
ANL 2 20,681,907<br />
Inst HEP (China) 1 20,652,667<br />
USGS 2 20,588,221<br />
Rice U 5 20,020,985<br />
NC State U 24 19,046,770<br />
89