TGQR 2010Q4 Report.pdf - Teragridforum.org
TGQR 2010Q4 Report.pdf - Teragridforum.org
TGQR 2010Q4 Report.pdf - Teragridforum.org

You also want an ePaper? Increase the reach of your titles
YUMPU automatically turns print PDFs into web optimized ePapers that Google loves.
2.2.9<br />
Computer and Computation Research: eaviv—Distributed visualization (PI: Andrei<br />
Hutanu, Louisiana State U.)<br />
Scientific research is increasingly dependent on simulation and analysis requiring high<br />
performance computers, distributed large-scale data, and high-speed<br />
networks. Andrei Hutanu of LSU leads a team addressing fundamental<br />
issues in distributed visualization design and implementation, where<br />
network services represent a first-class resource. They built a distributed<br />
visualization system, eaviv, and a distributed visualization application<br />
optimized for large data, high-speed networks and interaction. eaviv<br />
connects Spider at LSU’s Center for Computation & Technology<br />
(CCT), Lincoln and accelerator clusters at NCSA, and a cluster at the<br />
Laboratory of Advanced Networking Technologies (SITOLA) at<br />
Masaryk University in the Czech Republic. The Internet2 interoperable<br />
On-demand Network (ION) provides wide-area connectivity to support<br />
dynamic network circuit services, and NCSA’s mass storage system<br />
provided permanent data storage. Applications request and reserve<br />
point-to-point circuits between sites as needed using automated control<br />
software. eaviv supports distributed collaboration, letting multiple users<br />
in physically distributed locations interact with the same visualization to<br />
communicate their ideas and explore the datasets cooperatively. The team implemented a raycasting<br />
parallel volume renderer called Pcaster as the rendering component to demonstrate the<br />
distributed pipeline’s workflow. Compared to parallel volume renderers in existing software,<br />
Pcaster is a purely GPU-based volume renderer and image compositor supporting high-resolution<br />
rendering. Pcaster asynchronously couples with parallel data servers for network-streamed data<br />
input. The team tested Pcaster with data sets up to 64 gigabytes per timestep and achieved<br />
interactive frame rates of five to 10 frames per second on Lincoln to produce render images of<br />
1,024 x 1,024 resolution. The eaviv system’s configurable architecture also allows it to run with a<br />
local data server and a single renderer, making it a desktop tool for small-scale local data.<br />
This research was published in 2010 in Scalable Computing: Practice and Experience and<br />
Computing in Science and Engineering, and was presented at the TeraGrid 10 conference.<br />
2.2.10<br />
Computational Mathematics: Residual Based Turbulence Models for Large Eddy<br />
Simulation on Unstructured Tetrahedral Meshes (PI: Arif Masud, U. Illinois)<br />
Development of computational methods for modeling turbulent<br />
flows is considered a formidable challenge due to the plethora of<br />
associated spatial and temporal scales. Professor Arif Masud and<br />
graduate student Ramon Calderer from the Department of Civil<br />
and Environmental Engineering at the University of Illinois at<br />
Urbana-Champaign used Abe at NCSA to develop residual-based<br />
methods for modeling turbulence in complex fluid flows and<br />
fluid-structure interactions. Their new codes are mathematically<br />
consistent and robust and provide high-fidelity solutions at<br />
reduced computational costs compared to the more traditional<br />
Direct Numerical Simulations (DNS).<br />
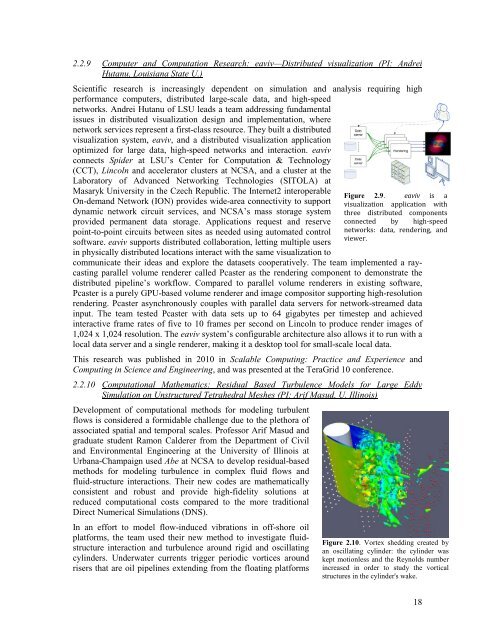
In an effort to model flow-induced vibrations in off-shore oil<br />
platforms, the team used their new method to investigate fluidstructure<br />
interaction and turbulence around rigid and oscillating<br />
cylinders. Underwater currents trigger periodic vortices around<br />
risers that are oil pipelines extending from the floating platforms<br />
Figure 2.9. eaviv is a<br />
visualization application with<br />
three distributed components<br />
connected by high-speed<br />
networks: data, rendering, and<br />
viewer.<br />
Figure 2.10. Vortex shedding created by<br />
an oscillating cylinder: the cylinder was<br />
kept motionless and the Reynolds number<br />
increased in order to study the vortical<br />
structures in the cylinder's wake.<br />
18