- Page 1 and 2:
NSF Extensible Terascale Facility T
- Page 3 and 4:
Working Group Leaders Accounting Ad
- Page 5 and 6:
6.5 RP Operations: Accounting/Core
- Page 7 and 8:
1 Overview The TeraGrid is an open
- Page 9 and 10:
accounting system; an additional 94
- Page 11 and 12:
2 Science and Engineering Highlight
- Page 13 and 14:
and that they will be able to deter
- Page 15 and 16:
Enhancements in photocurrent have b
- Page 17 and 18:
2.2.8 Chemistry: Molecular Simulati
- Page 19 and 20:
to the seafloor. Vortex shedding ca
- Page 21 and 22:
In 2010, Aidun and colleagues made
- Page 23 and 24:
in treating diabetes and obesity. T
- Page 25 and 26:
2.2.18 Physics: The Geophysical Hig
- Page 27 and 28:
service. In addition to GRAM5, we a
- Page 29 and 30:
Figure 4-2 Q4 usage by gateway. The
- Page 31 and 32:
hearing about the experiments, many
- Page 33 and 34:
John Cobb presented the capstone ta
- Page 35 and 36:
Work initiated by a helpdesk ticket
- Page 37 and 38:
machine) runs limit use of the syst
- Page 39 and 40:
PI Name Joseph Hargitai, Albert Ein
- Page 41 and 42:
helped Robert Coridan (UIUC) to exp
- Page 43 and 44:
Approach to Physics-based Seismic H
- Page 45 and 46:
Helly, SIO/UCSD Lattice Gauge Calcu
- Page 47 and 48: College Simulation and Data Analysi
- Page 49 and 50: During this quarter Cui prepared an
- Page 51 and 52: 7. Minor performance improvements,
- Page 53 and 54: OpenMP. Plan is to continue the eff
- Page 55 and 56: • Joel Ledford of the California
- Page 57 and 58: The team also mentioned that they h
- Page 59 and 60: the makefile for compiling the sour
- Page 61 and 62: Implement test cases for MPI based
- Page 63 and 64: User news was posted to inform the
- Page 65 and 66: authentication infrastructures. Wit
- Page 67 and 68: 6.5 RP Operations: Accounting/Core
- Page 69 and 70: Note that the total repository of T
- Page 71 and 72: From an analysis of the hits for wh
- Page 73 and 74: 7.2 Data 7.2.1 Data Movement contin
- Page 75 and 76: historical time series of average p
- Page 77 and 78: on a demonstration that took place
- Page 79 and 80: NCSA's SGI Altix UV system, Ember,
- Page 81 and 82: 8.5.2 Job Submission (GRAM) Statist
- Page 83 and 84: 8.7 Security 8.7.1 Security Working
- Page 85 and 86: 8.8.4 PSC During October, the PSC s
- Page 87 and 88: Figure 8-8. TeraGrid Usage Summary
- Page 89 and 90: Arun Yethiraj, U Wisconsin-Madison
- Page 91 and 92: Institution Users NUs BRI City of H
- Page 93 and 94: 4. Review Suggested Keywords - TIS
- Page 95 and 96: YNT publications are intended for u
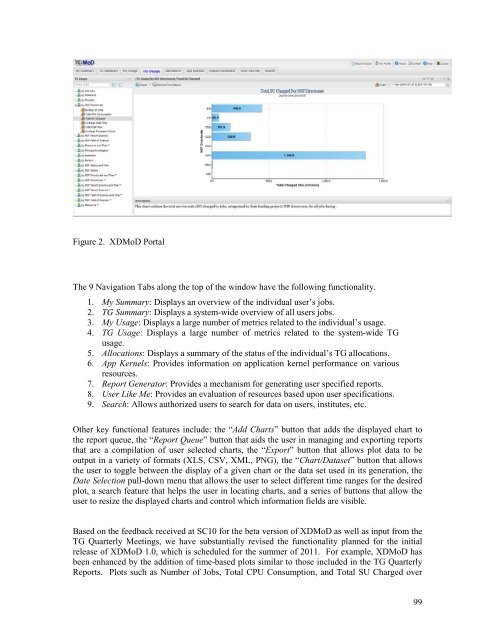
- Page 97: In response to feedback from the Sc
- Page 101 and 102: Figure 5. Total number of TG jobs r
- Page 103 and 104: Figure 8. Total CPU Consumption per
- Page 105 and 106: Figure 10: XDMoD data warehouse sch
- Page 107 and 108: Figure 12. AMBER-based application
- Page 109 and 110: Dr. Ann Zimmerman of the University
- Page 111 and 112: • Personal utilization informatio
- Page 113 and 114: 2) Given the emergence of Green tec
- Page 115 and 116: supercomputers were a huge draw for
- Page 117 and 118: sciences by enabling and stimulatin
- Page 119 and 120: The TeraGrid booth showcased group
- Page 121 and 122: 10.2 EOT Impact Stories Indiana IU
- Page 123 and 124: The Ranger system at the Texas Adva
- Page 125 and 126: conference to assess their level of
- Page 127 and 128: Also at SC10 Rebecca Day, a teacher
- Page 129 and 130: NCAR For the first time, SIParCS ou
- Page 131 and 132: communicates TeraGrid’s impact. L
- Page 133 and 134: 10/18/2010: TeraGrid Partner SDSC M
- Page 135 and 136: 10.11 Broader Impacts LONI As part
- Page 137 and 138: 14 TeraGrid/Open Science Grid (OSG)
- Page 139 and 140: • Task I2.1 (Run RAPTOR-OOPS work
- Page 141 and 142: 22. Chourasia, A. 2010. GlyphSea. I
- Page 143 and 144: A.2. Publications from TeraGrid Use
- Page 145 and 146: 30. Tchekhovskoy, A., Narayan, R.,
- Page 147 and 148: 70. P. M. Motl, J. E. Tohline & J.
- Page 149 and 150:
114. Krolik:Invited talk “Connect
- Page 151 and 152:
142. Houston, A. L. and R. B. Wilhe
- Page 153 and 154:
175. VAN POPPEL, B., DESJARDINS, O.
- Page 155 and 156:
208. J B. Clemens, E. A. Chagarov,
- Page 157 and 158:
238. M.H. Alkordi, A.C. Stern, J.L.
- Page 159 and 160:
DMR050002 272. Unusual dielectric r
- Page 161 and 162:
306. J. Lind, R.M. Suter, “3DXRD
- Page 163 and 164:
348. T.-L. Chan, J.R. Chelikowsky,
- Page 165 and 166:
383. A. Szyperska, J. Rak, J. Leszc
- Page 167 and 168:
416. Armstrong, B. D.; Soto, P.; Sh
- Page 169 and 170:
446. S. A. Shaikh and E. Tajkhorshi
- Page 171 and 172:
483. J´erˆome H´enin, Grace Bran
- Page 173 and 174:
MCB070009 521. J. Lee, S. Ham, and
- Page 175 and 176:
555. Lintao Bu, G.T. Beckham, M.R.
- Page 177 and 178:
Physics MCA06N025 587. “Nuclear P
- Page 179 and 180:
614. Scaling studies of QCD with th
- Page 181 and 182:
PHY060028 645. M. Campanelli, C. O.
- Page 183 and 184:
Astronomical Sciences AST060031 7.
- Page 185 and 186:
47. Reynolds, D. R., Hayes, J. C.,
- Page 187 and 188:
February 17. 91. Liang, X.-Z., 2010
- Page 189 and 190:
123. J.C. Fox, A. Gupta, H.H. Bayra
- Page 191 and 192:
166. Bernard,P.S.,Collins,J.P.andPo
- Page 193 and 194:
Noncolloidal Suspensions,” 7 th I
- Page 195 and 196:
249. V.A. Shubert, C.W. Muller and
- Page 197 and 198:
Motion Simulations in the Central U
- Page 199 and 200:
331. L.K. Wagner and J.C. Grossman.
- Page 201 and 202:
377. Lawrenz, M., Wereszczynski, J.
- Page 203 and 204:
423. C. Maffeo, R. Schopflin, H. Br
- Page 205 and 206:
463. Zhong, L., Walker, R.C., Brady
- Page 207 and 208:
513. McWilliams, J. C., and M. J. M
- Page 209 and 210:
557. Strong-Field Ionization of Lit
- Page 211 and 212:
613. F. Foucart, M. D. Duez, L. E.
- Page 213 and 214:
Seminar What is Cyberinfrastructure
- Page 215 and 216:
P Tour Tech 104 IUPUI, Indianap oli
- Page 217 and 218:
Online Tutorial Parallel Numerical
- Page 219 and 220:
Type Title Location Date(s) Hours N
- Page 221 and 222:
the Classroom Conf. Present‟n Fro
- Page 223 and 224:
m; San Diego, CA Workshop (Teachers
- Page 225 and 226:
Tour Ranger Tour and Cluster Manage
- Page 227 and 228:
Presentation Presentation Extreme-S
- Page 229 and 230:
Work Package Dependencies Planned Q
- Page 231 and 232:
SI.MTS 2.5.10.2 P Metascheduling ca
- Page 233 and 234:
Work Package Dependencies Planned Q
- Page 235 and 236:
Work Package Dependencies Planned Q
- Page 237 and 238:
Project-ID WBS OPMD TeraGrid AUS PY
- Page 239 and 240:
Project-ID WBS OPMD Description Ter
- Page 241 and 242:
Work Package Dependencies Planned R
- Page 243 and 244:
Work Package Dependencies Planned R
- Page 245 and 246:
DV.DC.RP.TACC 3.0.1.22 O TACC RP Da
- Page 247 and 248:
Bennett[30%], ongoing NOS.Sec.RP.PS
- Page 249 and 250:
NOS.INCA 4.4.3.3 P knowledgbase lin
- Page 251 and 252:
QSR 2010Q4 Report Values QSR 2010Q3
- Page 253 and 254:
QSR 2010Q4 Report Values QSR 2010Q3
- Page 255 and 256:
Among the participants were sixty g
- Page 257 and 258:
the talks should address less on th
- Page 259 and 260:
Appendix A - Summer School Agenda M
- Page 261 and 262:
Appendix B - Attendees, Staff and P
- Page 263 and 264:
Staff and Presenters Ferrer Annika