


Create successful ePaper yourself
Turn your PDF publications into a flip-book with our unique Google optimized e-Paper software.
Table 3.<br />
Tied P-Values for Differences in Perceived Trends between Resource, Habitats, Threats and Compliance Categories.<br />
Non-Parametric Test Statistic<br />
Indicators _________________________________________________________<br />
CpUE Habitats Threats Compliance<br />
Test for Variation Between Indicator<br />
Categories (Kruskal-Wallis) 1 0.09 0.0001 0.0001 0.0001<br />
1<br />
Siegel & Castellan (1988).<br />
Indicator categories reflect broad groupings <strong>of</strong> resources, habitats, threats or management rules (e.g., ‘finfish’ and ‘shellfish’ resources for the CpUE<br />
indicator).<br />
P-values show the significance <strong>of</strong> the test statistic. A p-value <strong>of</strong> 0.0001 indicates a probability <strong>of</strong> less than one in 10,000 that the differences in<br />
perceptions for the various categories occurs by chance (SAS 1998).<br />
The Kruskal-Wallis test is a non-parametric version <strong>of</strong> a one-way analysis <strong>of</strong> variance by ranks that tests the null hypothesis that the categories<br />
come from the same distribution.<br />
No. <strong>of</strong> responses<br />
180<br />
160<br />
140<br />
120<br />
100<br />
80<br />
60<br />
40<br />
20<br />
0<br />
Declining<br />
a lot<br />
Catch per unit <strong>of</strong> effort perceptions<br />
Declining<br />
a little<br />
Stable<br />
N: 399 reponses (3 resources per focus group)<br />
Improving<br />
a little<br />
Improving<br />
a lot<br />
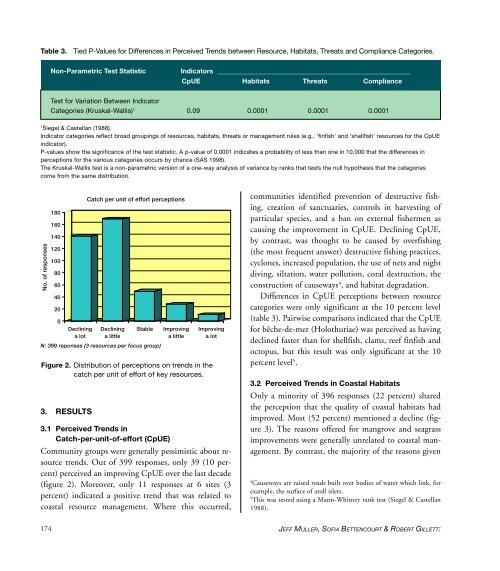
Figure 2. Distribution <strong>of</strong> perceptions on trends in the<br />
catch per unit <strong>of</strong> effort <strong>of</strong> key resources.<br />
3. RESULTS<br />
3.1 Perceived Trends in<br />
Catch-per-unit-<strong>of</strong>-effort (CpUE)<br />
Community groups were generally pessimistic about resource<br />
trends. Out <strong>of</strong> 399 responses, only 39 (10 percent)<br />
perceived an improving CpUE over the last decade<br />
(figure 2). Moreover, only 11 responses at 6 sites (3<br />
percent) indicated a positive trend that was related to<br />
coastal resource management. Where this occurred,<br />
communities identified prevention <strong>of</strong> destructive fishing,<br />
creation <strong>of</strong> sanctuaries, controls in harvesting <strong>of</strong><br />
particular species, and a ban on external fishermen as<br />
causing the improvement in CpUE. Declining CpUE,<br />
by contrast, was thought to be caused by overfishing<br />
(the most frequent answer) destructive fishing practices,<br />
cyclones, increased population, the use <strong>of</strong> nets and night<br />
diving, siltation, water pollution, coral destruction, the<br />
construction <strong>of</strong> causeways 4 , and habitat degradation.<br />
Differences in CpUE perceptions between resource<br />
categories were only significant at the 10 percent level<br />
(table 3). Pairwise comparisons indicated that the CpUE<br />
for bêche-de-mer (Holothuriae) was perceived as having<br />
declined faster than for shellfish, clams, reef finfish and<br />
octopus, but this result was only significant at the 10<br />
percent level 5 .<br />
3.2 Perceived Trends in Coastal Habitats<br />
Only a minority <strong>of</strong> 396 responses (22 percent) shared<br />
the perception that the quality <strong>of</strong> coastal habitats had<br />
improved. Most (52 percent) mentioned a decline (figure<br />
3). The reasons <strong>of</strong>fered for mangrove and seagrass<br />
improvements were generally unrelated to coastal management.<br />
By contrast, the majority <strong>of</strong> the reasons given<br />
4<br />
Causeways are raised roads built over bodies <strong>of</strong> water which link, for<br />
example, the surface <strong>of</strong> atoll islets.<br />
5<br />
This was tested using a Mann-Whitney rank test (Siegel & Castellan<br />
1988).<br />
174<br />
JEFF MULLER, SOFIA BETTENCOURT & ROBERT GILLETT:


