


Create successful ePaper yourself
Turn your PDF publications into a flip-book with our unique Google optimized e-Paper software.
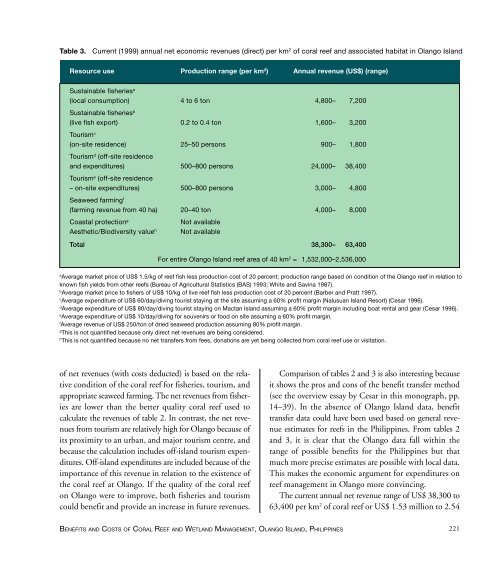
Table 3.<br />
Current (1999) annual net economic revenues (direct) per km 2 <strong>of</strong> coral reef and associated habitat in Olango Island<br />
Resource use Production range (per km 2 ) Annual revenue (US$) (range)<br />
Sustainable fisheries a<br />
(local consumption) 4 to 6 ton 4,800– 7,200<br />
Sustainable fisheries b<br />
(live fish export) 0.2 to 0.4 ton 1,600– 3,200<br />
Tourism c<br />
(on-site residence) 25–50 persons 900– 1,800<br />
Tourism d (<strong>of</strong>f-site residence<br />
and expenditures) 500–800 persons 24,000– 38,400<br />
Tourism e (<strong>of</strong>f-site residence<br />
– on-site expenditures) 500–800 persons 3,000– 4,800<br />
Seaweed farming f<br />
(farming revenue from 40 ha) 20–40 ton 4,000– 8,000<br />
Coastal protection g<br />
Not available<br />
Aesthetic/Biodiversity value h Not available<br />
Total 38,300– 63,400<br />
For entire Olango Island reef area <strong>of</strong> 40 km 2 = 1,532,000–2,536,000<br />
a<br />
Average market price <strong>of</strong> US$ 1.5/kg <strong>of</strong> reef fish less production cost <strong>of</strong> 20 percent; production range based on condition <strong>of</strong> the Olango reef in relation to<br />
known fish yields from other reefs (Bureau <strong>of</strong> Agricultural Statistics (BAS) 1993; White and Savina 1987).<br />
b<br />
Average market price to fishers <strong>of</strong> US$ 10/kg <strong>of</strong> live reef fish less production cost <strong>of</strong> 20 percent (Barber and Pratt 1997).<br />
c<br />
Average expenditure <strong>of</strong> US$ 60/day/diving tourist staying at the site assuming a 60% pr<strong>of</strong>it margin (Nalusuan Island Resort) (Cesar 1996).<br />
d<br />
Average expenditure <strong>of</strong> US$ 80/day/diving tourist staying on Mactan Island assuming a 60% pr<strong>of</strong>it margin including boat rental and gear (Cesar 1996).<br />
e<br />
Average expenditure <strong>of</strong> US$ 10/day/diving for souvenirs or food on site assuming a 60% pr<strong>of</strong>it margin.<br />
f<br />
Average revenue <strong>of</strong> US$ 250/ton <strong>of</strong> dried seaweed production assuming 80% pr<strong>of</strong>it margin.<br />
g<br />
This is not quantified because only direct net revenues are being considered.<br />
h<br />
This is not quantified because no net transfers from fees, donations are yet being collected from coral reef use or visitation.<br />
<strong>of</strong> net revenues (with costs deducted) is based on the relative<br />
condition <strong>of</strong> the coral reef for fisheries, tourism, and<br />
appropriate seaweed farming. The net revenues from fisheries<br />
are lower than the better quality coral reef used to<br />
calculate the revenues <strong>of</strong> table 2. In contrast, the net revenues<br />
from tourism are relatively high for Olango because <strong>of</strong><br />
its proximity to an urban, and major tourism centre, and<br />
because the calculation includes <strong>of</strong>f-island tourism expenditures.<br />
Off-island expenditures are included because <strong>of</strong> the<br />
importance <strong>of</strong> this revenue in relation to the existence <strong>of</strong><br />
the coral reef at Olango. If the quality <strong>of</strong> the coral reef<br />
on Olango were to improve, both fisheries and tourism<br />
could benefit and provide an increase in future revenues.<br />
Comparison <strong>of</strong> tables 2 and 3 is also interesting because<br />
it shows the pros and cons <strong>of</strong> the benefit transfer method<br />
(see the overview essay by Cesar in this monograph, pp.<br />
14–39). In the absence <strong>of</strong> Olango Island data, benefit<br />
transfer data could have been used based on general revenue<br />
estimates for reefs in the Philippines. From tables 2<br />
and 3, it is clear that the Olango data fall within the<br />
range <strong>of</strong> possible benefits for the Philippines but that<br />
much more precise estimates are possible with local data.<br />
This makes the economic argument for expenditures on<br />
reef management in Olango more convincing.<br />
The current annual net revenue range <strong>of</strong> US$ 38,300 to<br />
63,400 per km 2 <strong>of</strong> coral reef or US$ 1.53 million to 2.54<br />
BENEFITS AND COSTS OF CORAL REEF AND WETLAND MANAGEMENT, OLANGO ISLAND, PHILIPPINES<br />
221


