


You also want an ePaper? Increase the reach of your titles
YUMPU automatically turns print PDFs into web optimized ePapers that Google loves.
damaged the coastal road going into Portland Ridge in<br />
recent years. For the Portland Bight, Cesar et al. (2000)<br />
estimate that the total coastal protection value is around<br />
US$ 3.55 million in net present value terms or nearly<br />
US$ 400,000 per year (with 10% discount rate). Destruction<br />
<strong>of</strong> coastal ecosystems lowers the value <strong>of</strong> the<br />
coastal protection. It is assumed following Pet-Soede et al.<br />
(1999) that 1% loss in coastal ecosystems leads to 1% loss<br />
in the coastal protection function, and this in turn to a loss<br />
in 1% <strong>of</strong> the value <strong>of</strong> the coastline. With a 1% mangrove<br />
decline in the absence <strong>of</strong> park management and stabilisation<br />
with park management, the benefits <strong>of</strong> the PBPA<br />
in terms <strong>of</strong> coastal protection are US$ 40,000 per year.<br />
Biodiversity<br />
To estimate biodiversity in a developing country,<br />
Ruitenbeek (1992) suggests to take the value <strong>of</strong> foreign<br />
support likely to be available to protect the biodiverse<br />
resource through NGOs, the Global Environment Facility<br />
(GEF) as well as through other means. A recent study<br />
for Indonesia showed that two marine parks were able to<br />
capitalise on their global value <strong>of</strong> biological diversity, by<br />
obtaining an average <strong>of</strong> US$ 10,000 per km 2 (Cesar et<br />
al. 2000). In the PBPA, the area <strong>of</strong> most interest to<br />
biodiversity are the Hellshire Hills (90 km 2 ), the Portland<br />
Ridge (50 km 2 ), the wetlands (82 km 2 ) and the rest<br />
<strong>of</strong> the strip along the coast (around 80 km 2 as well).<br />
Therefore, an area <strong>of</strong> roughly 200 km 2 could be eligible<br />
for global grant funding <strong>of</strong> around US$ 10,000 per year,<br />
giving cash revenue <strong>of</strong> US$ 2,000,000 per year. This<br />
grant money would not be available in the absence <strong>of</strong><br />
park management.<br />
Total Benefits <strong>of</strong> PBPA<br />
The values <strong>of</strong> the ecosystems services can be combined<br />
to calculate the total benefits <strong>of</strong> the PBPA. To do so, the<br />
difference in value between a ‘with PBPA’ scenario and a<br />
‘without PBPA’ scenario needs to be calculated. However,<br />
as discussed, the aggregation <strong>of</strong> economic values would still<br />
need to take the compatibility <strong>of</strong> the different functions<br />
for a specific use into account (Spurgeon 1992; Barton<br />
1994). Of all the services discussed above, the only one<br />
not compatible with sustainable use <strong>of</strong> the other ecosystem<br />
services is charcoal production. Therefore, in the<br />
‘with PBPA’ scenario, charcoal production will stop. For<br />
the sake <strong>of</strong> argument, it is assumed that the changes will<br />
be complete in one generation (25 years), so that fisheries<br />
will be back at its maximum sustainable yield in 2025.<br />
Likewise, tourism and recreation will be at their full ecotourism<br />
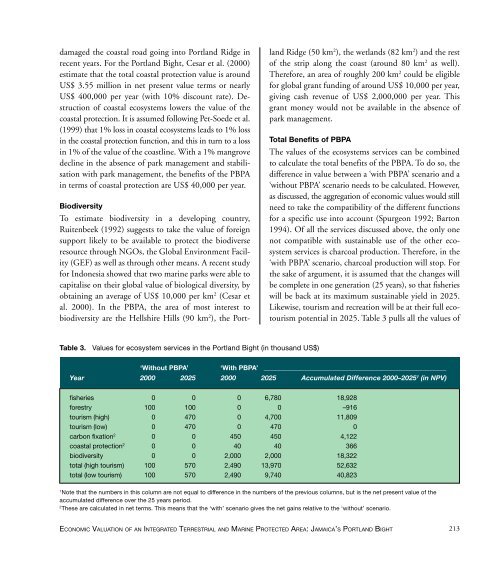
potential in 2025. Table 3 pulls all the values <strong>of</strong><br />
Table 3.<br />
Values for ecosystem services in the Portland Bight (in thousand US$)<br />
‘Without PBPA’ ‘With PBPA’ ______________________________________________________<br />
Year 2000 2025 2000 2025 Accumulated Difference 2000–2025 1 (in NPV)<br />
fisheries 0 0 0 6,780 18,928<br />
forestry 100 100 0 0 –916<br />
tourism (high) 0 470 0 4,700 11,809<br />
tourism (low) 0 470 0 470 0<br />
carbon fixation 2 0 0 450 450 4,122<br />
coastal protection 2 0 0 40 40 366<br />
biodiversity 0 0 2,000 2,000 18,322<br />
total (high tourism) 100 570 2,490 13,970 52,632<br />
total (low tourism) 100 570 2,490 9,740 40,823<br />
1<br />
Note that the numbers in this column are not equal to difference in the numbers <strong>of</strong> the previous columns, but is the net present value <strong>of</strong> the<br />
accumulated difference over the 25 years period.<br />
2<br />
These are calculated in net terms. This means that the ‘with’ scenario gives the net gains relative to the ‘without’ scenario.<br />
ECONOMIC VALUATION OF AN INTEGRATED TERRESTRIAL AND MARINE PROTECTED AREA: JAMAICA’S PORTLAND BIGHT<br />
213


