


You also want an ePaper? Increase the reach of your titles
YUMPU automatically turns print PDFs into web optimized ePapers that Google loves.
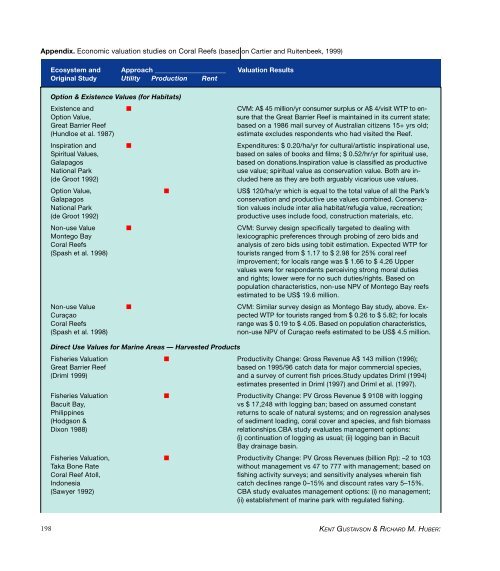
Appendix. Economic valuation studies on <strong>Coral</strong> <strong>Reefs</strong> (based on Cartier and Ruitenbeek, 1999)<br />
Ecosystem and Approach _____________________ Valuation Results<br />
Original Study Utility Production Rent<br />
Option & Existence Values (for Habitats)<br />
Existence and ■ CVM: A$ 45 million/yr consumer surplus or A$ 4/visit WTP to en-<br />
Option Value,<br />
sure that the Great Barrier Reef is maintained in its current state;<br />
Great Barrier Reef<br />
based on a 1986 mail survey <strong>of</strong> Australian citizens 15+ yrs old;<br />
(Hundloe et al. 1987)<br />
estimate excludes respondents who had visited the Reef.<br />
Inspiration and ■ Expenditures: $ 0.20/ha/yr for cultural/artistic inspirational use,<br />
Spiritual Values,<br />
based on sales <strong>of</strong> books and films; $ 0.52/hr/yr for spiritual use,<br />
Galapagos<br />
based on donations.Inspiration value is classified as productive<br />
National Park<br />
use value; spiritual value as conservation value. Both are in-<br />
(de Groot 1992)<br />
cluded here as they are both arguably vicarious use values.<br />
Option Value, ■ US$ 120/ha/yr which is equal to the total value <strong>of</strong> all the Park’s<br />
Galapagos<br />
conservation and productive use values combined. Conserva-<br />
National Park<br />
tion values include inter alia habitat/refugia value, recreation;<br />
(de Groot 1992)<br />
productive uses include food, construction materials, etc.<br />
Non-use Value ■ CVM: Survey design specifically targeted to dealing with<br />
Montego Bay<br />
lexicographic preferences through probing <strong>of</strong> zero bids and<br />
<strong>Coral</strong> <strong>Reefs</strong><br />
analysis <strong>of</strong> zero bids using tobit estimation. Expected WTP for<br />
(Spash et al. 1998)<br />
tourists ranged from $ 1.17 to $ 2.98 for 25% coral reef<br />
improvement; for locals range was $ 1.66 to $ 4.26 Upper<br />
values were for respondents perceiving strong moral duties<br />
and rights; lower were for no such duties/rights. Based on<br />
population characteristics, non-use NPV <strong>of</strong> Montego Bay reefs<br />
estimated to be US$ 19.6 million.<br />
Non-use Value ■ CVM: Similar survey design as Montego Bay study, above. Ex-<br />
Curaçao<br />
pected WTP for tourists ranged from $ 0.26 to $ 5.82; for locals<br />
<strong>Coral</strong> <strong>Reefs</strong><br />
range was $ 0.19 to $ 4.05. Based on population characteristics,<br />
(Spash et al. 1998)<br />
non-use NPV <strong>of</strong> Curaçao reefs estimated to be US$ 4.5 million.<br />
Direct Use Values for Marine Areas — Harvested Products<br />
Fisheries Valuation ■ Productivity Change: Gross Revenue A$ 143 million (1996);<br />
Great Barrier Reef<br />
based on 1995/96 catch data for major commercial species,<br />
(Driml 1999) and a survey <strong>of</strong> current fish prices.Study updates Driml (1994)<br />
estimates presented in Driml (1997) and Driml et al. (1997).<br />
Fisheries Valuation ■ Productivity Change: PV Gross Revenue $ 9108 with logging<br />
Bacuit Bay,<br />
vs $ 17,248 with logging ban; based on assumed constant<br />
Philippines<br />
returns to scale <strong>of</strong> natural systems; and on regression analyses<br />
(Hodgson &<br />
<strong>of</strong> sediment loading, coral cover and species, and fish biomass<br />
Dixon 1988)<br />
relationships.CBA study evaluates management options:<br />
(i) continuation <strong>of</strong> logging as usual; (ii) logging ban in Bacuit<br />
Bay drainage basin.<br />
Fisheries Valuation, ■ Productivity Change: PV Gross Revenues (billion Rp): –2 to 103<br />
Taka Bone Rate<br />
without management vs 47 to 777 with management; based on<br />
<strong>Coral</strong> Reef Atoll,<br />
fishing activity surveys; and sensitivity analyses wherein fish<br />
Indonesia catch declines range 0–15% and discount rates vary 5–15%.<br />
(Sawyer 1992)<br />
CBA study evaluates management options: (i) no management;<br />
(ii) establishment <strong>of</strong> marine park with regulated fishing.<br />
198<br />
KENT GUSTAVSON & RICHARD M. HUBER:


