


Create successful ePaper yourself
Turn your PDF publications into a flip-book with our unique Google optimized e-Paper software.
marginal benefit function, relating price to changes in<br />
coral reef abundance, further assumptions were required<br />
regarding the relationship between the categories <strong>of</strong><br />
values and coral reef abundance or quality. Specifically, a<br />
linear relationship is assumed between reef quality and<br />
local use values and non-use utility values. This is most<br />
likely not the case, but assuming a less simplified relationship<br />
cannot be justified given our current knowledge.<br />
Only the results <strong>of</strong> the bioprospecting valuation<br />
model (Ruitenbeek & Cartier 1999) allowed the specification<br />
<strong>of</strong> a different functional form. As noted by<br />
Ruitenbeek & Cartier (1999), total net marginal values<br />
will likely be over-estimated in some instances and under-estimated<br />
in others.<br />
The total benefit attributed to the coral reefs <strong>of</strong> the<br />
Montego Bay Marine Park is estimated at US$ 470 million<br />
(table 1). Every 1% change in abundance is likely to<br />
generate a marginal benefit <strong>of</strong> US$ 10 million or, alternatively,<br />
the marginal price <strong>of</strong> coral reef is approximately<br />
US$ 23 million/ha (Ruitenbeek & Cartier 1999). Most <strong>of</strong><br />
the value is attributed to tourism. Coastal protection and<br />
non-use utility benefits also contribute, but to a much<br />
lesser extent. Existing fisheries and the potential development<br />
<strong>of</strong> a bioprospecting program have a negligible<br />
effect on marginal values (Ruitenbeek & Cartier 1999).<br />
marginal cost and benefit (million US$/% coral cover)<br />
40<br />
35<br />
30<br />
25<br />
20<br />
15<br />
10<br />
5<br />
13% improvment<br />
0<br />
29 40 50<br />
coral abundance (%)<br />
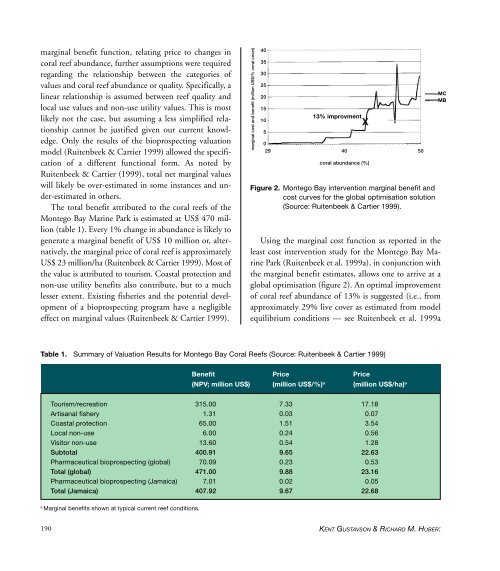
Figure 2. Montego Bay intervention marginal benefit and<br />
cost curves for the global optimisation solution<br />
(Source: Ruitenbeek & Cartier 1999).<br />
Using the marginal cost function as reported in the<br />
least cost intervention study for the Montego Bay Marine<br />
Park (Ruitenbeek et al. 1999a), in conjunction with<br />
the marginal benefit estimates, allows one to arrive at a<br />
global optimisation (figure 2). An optimal improvement<br />
<strong>of</strong> coral reef abundance <strong>of</strong> 13% is suggested (i.e., from<br />
approximately 29% live cover as estimated from model<br />
equilibrium conditions — see Ruitenbeek et al. 1999a<br />
MC<br />
MB<br />
Table 1. Summary <strong>of</strong> Valuation Results for Montego Bay <strong>Coral</strong> <strong>Reefs</strong> (Source: Ruitenbeek & Cartier 1999)<br />
Benefit Price Price<br />
(NPV; million US$) (million US$/%) a (million US$/ha) a<br />
Tourism/recreation 315.00 7.33 17.18<br />
Artisanal fishery 1.31 0.03 0.07<br />
Coastal protection 65.00 1.51 3.54<br />
Local non-use 6.00 0.24 0.56<br />
Visitor non-use 13.60 0.54 1.28<br />
Subtotal 400.91 9.65 22.63<br />
Pharmaceutical bioprospecting (global) 70.09 0.23 0.53<br />
Total (global) 471.00 9.88 23.16<br />
Pharmaceutical bioprospecting (Jamaica) 7.01 0.02 0.05<br />
Total (Jamaica) 407.92 9.67 22.68<br />
a<br />
Marginal benefits shown at typical current reef conditions.<br />
190<br />
KENT GUSTAVSON & RICHARD M. HUBER:


