The Nordic Model - Embracing globalization and sharing risks
The Nordic Model - Embracing globalization and sharing risks
The Nordic Model - Embracing globalization and sharing risks

You also want an ePaper? Increase the reach of your titles
YUMPU automatically turns print PDFs into web optimized ePapers that Google loves.
incentive effects of social security programmes, pension reforms<br />
being an important case in point. <strong>The</strong> provision of public services<br />
has been partly privatized or outsourced <strong>and</strong> it is increasingly being<br />
exposed to the forces of competition. <strong>The</strong> timing <strong>and</strong> sequencing<br />
differ somewhat between countries, but all <strong>Nordic</strong> countries have<br />
in the past two decades undertaken significant reforms of their<br />
public sectors <strong>and</strong> welfare policies.<br />
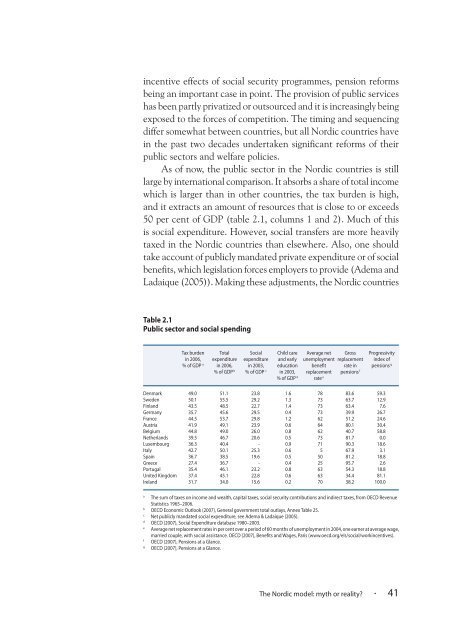
As of now, the public sector in the <strong>Nordic</strong> countries is still<br />
large by international comparison. It absorbs a share of total income<br />
which is larger than in other countries, the tax burden is high,<br />
<strong>and</strong> it extracts an amount of resources that is close to or exceeds<br />
50 per cent of GDP (table 2.1, columns 1 <strong>and</strong> 2). Much of this<br />
is social expenditure. However, social transfers are more heavily<br />
taxed in the <strong>Nordic</strong> countries than elsewhere. Also, one should<br />
take account of publicly m<strong>and</strong>ated private expenditure or of social<br />
benefits, which legislation forces employers to provide (Adema <strong>and</strong><br />
Ladaique (2005)). Making these adjustments, the <strong>Nordic</strong> countries<br />
Table 2.1<br />
Public sector <strong>and</strong> social spending<br />
Tax burden Total Social Child care Average net Gross Progressivity<br />
in 2006, expenditure expenditure <strong>and</strong> early unemployment replacement index of<br />
% of GDP a in 2006, in 2003, education benefit rate in pensions g<br />
% of GDP b % of GDP c in 2003, replacement pensions f<br />
% of GDP d rate e<br />
Denmark 49.0 51.1 23.8 1.6 78 83.6 59.3<br />
Sweden 50.1 55.5 29.2 1.3 73 63.7 12.9<br />
Finl<strong>and</strong> 43.5 48.5 22.7 1.4 73 63.4 7.6<br />
Germany 35.7 45.6 29.5 0.4 73 39.9 26.7<br />
France 44.5 53.7 29.8 1.2 62 51.2 24.6<br />
Austria 41.9 49.1 23.9 0.6 64 80.1 30.4<br />
Belgium 44.8 49.0 26.0 0.8 62 40.7 58.8<br />
Netherl<strong>and</strong>s 39.5 46.7 20.6 0.5 73 81.7 0.0<br />
Luxembourg 36.3 40.4 - 0.9 71 90.3 18.6<br />
Italy 42.7 50.1 25.3 0.6 5 67.9 3.1<br />
Spain 36.7 38.5 19.6 0.5 50 81.2 18.8<br />
Greece 27.4 36.7 - 0.4 25 95.7 2.6<br />
Portugal 35.4 46.1 23.2 0.8 63 54.3 18.8<br />
United Kingdom 37.4 45.1 22.8 0.6 63 34.4 81.1<br />
Irel<strong>and</strong> 31.7 34.0 15.6 0.2 70 38.2 100.0<br />
a<br />
<strong>The</strong> sum of taxes on income <strong>and</strong> wealth, capital taxes, social security contributions <strong>and</strong> indirect taxes, from OECD Revenue<br />
Statistics 1965–2006.<br />
b<br />
OECD Economic Outlook (2007), General government total outlays, Annex Table 25.<br />
c<br />
Net publicly m<strong>and</strong>ated social expenditure, see Adema & Ladaique (2005).<br />
d<br />
OECD (2007), Social Expenditure database 1980–2003.<br />
e<br />
Average net replacement rates in per cent over a period of 60 months of unemployment in 2004, one earner at average wage,<br />
married couple, with social assistance. OECD (2007), Benefits <strong>and</strong> Wages, Paris (www.oecd.org/els/social/workincentives).<br />
f<br />
OECD (2007), Pensions at a Glance.<br />
g<br />
OECD (2007), Pensions at a Glance.<br />
<strong>The</strong> <strong>Nordic</strong> model: myth or reality? · 41