The Nordic Model - Embracing globalization and sharing risks
The Nordic Model - Embracing globalization and sharing risks
The Nordic Model - Embracing globalization and sharing risks

Create successful ePaper yourself
Turn your PDF publications into a flip-book with our unique Google optimized e-Paper software.
it implies that the long-run deficit of the primary balance is “only”<br />
about 3.5 per cent of GDP compared to 4.3 per cent in the base<br />
scenario. This result may seem to contradict our statement above<br />
that productivity growth is not a solution to the financial problems<br />
arising from ageing. However, the reduction in the deficit<br />
in scenario A arises as a consequence of the index clause in the<br />
Finnish system for earnings pensions, according to which pensions<br />
are adjusted by 80 per cent of the rise in consumer prices <strong>and</strong> 20<br />
per cent of the rise in wages. Thus, an increase in productivity,<br />
which in the model is reflected in a corresponding increase in real<br />
wage growth, leads over time to a decline in pensions relative to<br />
wages. 3 Real wages in this scenario therefore increase more than<br />
the real value of pensions, <strong>and</strong> the income distribution will change<br />
in favour of those in work. Hence, this scenario actually underlines<br />
the conclusion made above, which is that increased productivity<br />
growth is a solution to the financial problem of the welfare state<br />
only if all people are not allowed to benefit from the increase in the<br />
pie. This is a possible route for reducing the public deficit, though<br />
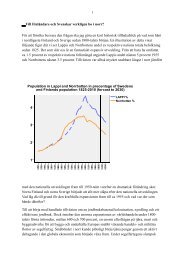
More rapid growth increases<br />
the tax base<br />
but also the public<br />
wage bill <strong>and</strong> transfers<br />
as well as dem<strong>and</strong> for<br />
welfare services <strong>and</strong><br />
leisure – growth will<br />
not solve the problem<br />
of public finances<br />
Primary balance as a per cent of GDP<br />
%<br />
0<br />
-1<br />
-2<br />
-3<br />
-4<br />
A<br />
Baseline<br />
B<br />
%<br />
0<br />
-1<br />
-2<br />
-3<br />
-4<br />
-5<br />
-6<br />
2010 15 20 25 30 35 40 45 50<br />
-5<br />
-6<br />
Figure 5.2<br />
Growth <strong>and</strong> public finances in Finl<strong>and</strong>, 2010–2050<br />
A = 0.5 % more productivity growth.<br />
B = A + 0.25 % more welfare service growth.<br />
Source: Ministry of Finance.<br />
92 · <strong>The</strong> <strong>Nordic</strong> <strong>Model</strong>