The Nordic Model - Embracing globalization and sharing risks
The Nordic Model - Embracing globalization and sharing risks
The Nordic Model - Embracing globalization and sharing risks

Create successful ePaper yourself
Turn your PDF publications into a flip-book with our unique Google optimized e-Paper software.
Table 3.1<br />
Venture capital investment, relative to GDP, 2000–2003<br />
Shares of high-tech<br />
Early stage Later stage a Communication IT Health/<br />
bioscience<br />
Denmark 0.057 0.065 13.2 19.3 28.2<br />
Finl<strong>and</strong> 0.085 0.104 13.5 20.0 1.3<br />
Sweden 0.088 0.147 10.2 13.9 17.3<br />
EU 0.041 0.089 13.5 11.7 9.9<br />
US 0.115 0.260 26.8 35.1 13.0<br />
a<br />
Expansion <strong>and</strong> replacement. All figures are averages for 2000–2003 relative to GDP.<br />
Source: OECD.<br />
Innovation <strong>and</strong> venture<br />
capital: <strong>The</strong> <strong>Nordic</strong>s<br />
do well but not<br />
well enough<br />
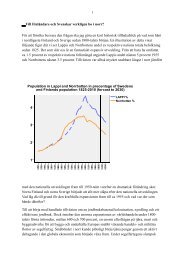
den also do well in terms of both indicators. A further interesting<br />
indicator for VC investment is the share of the investment that<br />
goes into different forms of high-technology activities. Here the<br />
picture is broadly similar: the <strong>Nordic</strong>s are in this respect ahead of<br />
EU on average but well behind the US.<br />
<strong>The</strong> figures suggest that the <strong>Nordic</strong> countries are doing relatively<br />
well in venture capital undertakings. However, it should be<br />
emphasized that this data shows only VC spending <strong>and</strong> not returns<br />
to VC investments; these results may give too rosy a picture. 8 Finally,<br />
it may be noted that R&D spending as a share of GDP, which<br />
is another indicator of innovative activity that may be relevant for<br />
general technological progress, is higher in the <strong>Nordic</strong>s (at 2.5–3.5<br />
per cent) than in the EU15 <strong>and</strong> the US (at some 2 per cent).<br />
Thus, the <strong>Nordic</strong> countries are doing significantly better than<br />
other EU countries as regards innovative activities, <strong>and</strong> they appear<br />
to be comparable to or not very far behind the US in these areas.<br />
More generally, this section <strong>and</strong> the Annex support the view that<br />
the <strong>Nordic</strong>s have been able to create institutions <strong>and</strong> policies (in<br />
areas such as education, market regulation <strong>and</strong> innovation), which<br />
have been conducive to a relatively favourable growth performance<br />
notably since the mid-1990s.<br />
<strong>The</strong> performance of the <strong>Nordic</strong> model · 53