The Nordic Model - Embracing globalization and sharing risks
The Nordic Model - Embracing globalization and sharing risks
The Nordic Model - Embracing globalization and sharing risks

Create successful ePaper yourself
Turn your PDF publications into a flip-book with our unique Google optimized e-Paper software.
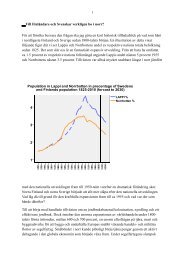
capital to GDP growth, since the mid-1990s, has been significant<br />
– <strong>and</strong> typically larger than that of non-IT capital. In fact, these<br />
countries were early starters in the use of IT <strong>and</strong> had high shares<br />
of IT capital relative to most other countries already in the mid-<br />
1990s, i.e. at the time that the IT revolution took off.<br />
Second, general technological change (TFP) has been important<br />
for the US, for Finl<strong>and</strong> <strong>and</strong> also, to an extent, for Sweden.<br />
It seems to have played much less of a role in Denmark <strong>and</strong> the<br />
EU15. TFP growth can be thought of as a measure of technological<br />
progress, which is not embodied in the explicit factors of production,<br />
i.e. in labour <strong>and</strong> the various types of capital. <strong>The</strong> non-measurable<br />
factors in TFP include innovations <strong>and</strong> improvements in<br />
general knowledge <strong>and</strong> the organization of production. However,<br />
since TFP growth is measured as a residual, it also contains effects<br />
such as cyclical variations, pure changes in efficiency, <strong>and</strong><br />
measurement errors. 12<br />
Third, there is more variation in the growth rates for conventional<br />
capital. Denmark <strong>and</strong> Sweden have had positive growth in<br />
conventional capital as well, whereas for Finl<strong>and</strong> conventional<br />
capital has played almost no role in the rapid growth in the second<br />
half of the 1990s. Investment in conventional capital continued<br />
to make a significant contribution to GDP growth in the US. <strong>The</strong><br />
Table 3.2<br />
Growth accounting<br />
Denmark Sweden Finl<strong>and</strong> USA EU15<br />
95–00 00–04 95–00 00–04 95–00 00–04 95–00 00–04 95–00 00–04<br />
GDP growth 2.8 1.3 3.5 2.0 4.9 2.3 4.2 2.4 2.7 1.5<br />
Growth contribution<br />
Labour 0.4 -0.1 0.7 -0.4 1.0 -0.3 1.3 -0.3 0.6 0.3<br />
IT capital 1.0 0.5 1.1 0.4 0.6 0.5 1.1 0.5 0.6 0.3<br />
Non IT-capital 0.8 0.9 0.4 0.2 -0.1 0.1 0.7 0.4 0.6 0.5<br />
TFP 0.6 0.3 1.3 1.9 3.3 2.0 1.1 1.7 0.9 0.4<br />
Growth of capital services<br />
IT capital 10.9 17.6 19.1 6.8 13.8 10.8 17.9 2.8 - -<br />
Non IT-capital 1.4 2.9 1.7 0.7 -0.2 0.2 9.1 1.8 - -<br />
Growth of labour input<br />
Total hours 0.6 -0.1 1.0 -0.6 1.6 -0.5 1.9 -0.4 0.9 0.4<br />
Hours of workers -0.4 0.1 -0.4 -0.5 -0.6 -0.8 -0.5 -0.3 -0.5 -0.3<br />
Number of workers 1.0 0.2 0.8 0.4 2.1 0.2 1.4 0.7 1.4 0.7<br />
<strong>The</strong> performance of the <strong>Nordic</strong> model · 59