2007 Annual Report - AIG.com
2007 Annual Report - AIG.com
2007 Annual Report - AIG.com
Create successful ePaper yourself
Turn your PDF publications into a flip-book with our unique Google optimized e-Paper software.
American International Group, Inc. and Subsidiaries<br />
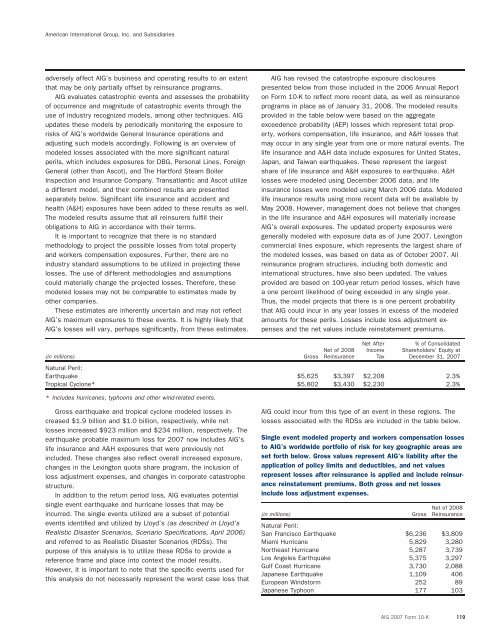
<strong>AIG</strong> has revised the catastrophe exposure disclosures<br />
presented below from those included in the 2006 <strong>Annual</strong> <strong>Report</strong><br />
on Form 10-K to reflect more recent data, as well as reinsurance<br />
programs in place as of January 31, 2008. The modeled results<br />
provided in the table below were based on the aggregate<br />
exceedence probability (AEP) losses which represent total prop-<br />
erty, workers <strong>com</strong>pensation, life insurance, and A&H losses that<br />
may occur in any single year from one or more natural events. The<br />
life insurance and A&H data include exposures for United States,<br />
Japan, and Taiwan earthquakes. These represent the largest<br />
share of life insurance and A&H exposures to earthquake. A&H<br />
losses were modeled using December 2006 data, and life<br />
insurance losses were modeled using March 2006 data. Modeled<br />
life insurance results using more recent data will be available by<br />
May 2008. However, management does not believe that changes<br />
in the life insurance and A&H exposures will materially increase<br />
<strong>AIG</strong>’s overall exposures. The updated property exposures were<br />
generally modeled with exposure data as of June <strong>2007</strong>. Lexington<br />
<strong>com</strong>mercial lines exposure, which represents the largest share of<br />
the modeled losses, was based on data as of October <strong>2007</strong>. All<br />
reinsurance program structures, including both domestic and<br />
international structures, have also been updated. The values<br />
provided are based on 100-year return period losses, which have<br />
a one percent likelihood of being exceeded in any single year.<br />
Thus, the model projects that there is a one percent probability<br />
that <strong>AIG</strong> could incur in any year losses in excess of the modeled<br />
amounts for these perils. Losses include loss adjustment expenses<br />
and the net values include reinstatement premiums.<br />
adversely affect <strong>AIG</strong>’s business and operating results to an extent<br />
that may be only partially offset by reinsurance programs.<br />
<strong>AIG</strong> evaluates catastrophic events and assesses the probability<br />
of occurrence and magnitude of catastrophic events through the<br />
use of industry recognized models, among other techniques. <strong>AIG</strong><br />
updates these models by periodically monitoring the exposure to<br />
risks of <strong>AIG</strong>’s worldwide General Insurance operations and<br />
adjusting such models accordingly. Following is an overview of<br />
modeled losses associated with the more significant natural<br />
perils, which includes exposures for DBG, Personal Lines, Foreign<br />
General (other than Ascot), and The Hartford Steam Boiler<br />
Inspection and Insurance Company. Transatlantic and Ascot utilize<br />
a different model, and their <strong>com</strong>bined results are presented<br />
separately below. Significant life insurance and accident and<br />
health (A&H) exposures have been added to these results as well.<br />
The modeled results assume that all reinsurers fulfill their<br />
obligations to <strong>AIG</strong> in accordance with their terms.<br />
It is important to recognize that there is no standard<br />
methodology to project the possible losses from total property<br />
and workers <strong>com</strong>pensation exposures. Further, there are no<br />
industry standard assumptions to be utilized in projecting these<br />
losses. The use of different methodologies and assumptions<br />
could materially change the projected losses. Therefore, these<br />
modeled losses may not be <strong>com</strong>parable to estimates made by<br />
other <strong>com</strong>panies.<br />
These estimates are inherently uncertain and may not reflect<br />
<strong>AIG</strong>’s maximum exposures to these events. It is highly likely that<br />
<strong>AIG</strong>’s losses will vary, perhaps significantly, from these estimates.<br />
Net After<br />
% of Consolidated<br />
Net of 2008 In<strong>com</strong>e Shareholders’ Equity at<br />
(in millions) Gross Reinsurance Tax December 31, <strong>2007</strong><br />
Natural Peril:<br />
Earthquake $5,625 $3,397 $2,208 2.3%<br />
Tropical Cyclone* $5,802 $3,430 $2,230 2.3%<br />
* Includes hurricanes, typhoons and other wind-related events.<br />
Gross earthquake and tropical cyclone modeled losses in- <strong>AIG</strong> could incur from this type of an event in these regions. The<br />
creased $1.9 billion and $1.0 billion, respectively, while net losses associated with the RDSs are included in the table below.<br />
losses increased $923 million and $234 million, respectively. The<br />
earthquake probable maximum loss for <strong>2007</strong> now includes <strong>AIG</strong>’s Single event modeled property and workers <strong>com</strong>pensation losses<br />
life insurance and A&H exposures that were previously not<br />
to <strong>AIG</strong>’s worldwide portfolio of risk for key geographic areas are<br />
included. These changes also reflect overall increased exposure, set forth below. Gross values represent <strong>AIG</strong>’s liability after the<br />
changes in the Lexington quota share program, the inclusion of application of policy limits and deductibles, and net values<br />
loss adjustment expenses, and changes in corporate catastrophe represent losses after reinsurance is applied and include reinsur-<br />
structure.<br />
ance reinstatement premiums. Both gross and net losses<br />
In addition to the return period loss, <strong>AIG</strong> evaluates potential include loss adjustment expenses.<br />
single event earthquake and hurricane losses that may be<br />
Net of 2008<br />
incurred. The single events utilized are a subset of potential (in millions) Gross Reinsurance<br />
events identified and utilized by Lloyd’s (as described in Lloyd’s Natural Peril:<br />
Realistic Disaster Scenarios, Scenario Specifications, April 2006) San Francisco Earthquake $6,236 $3,809<br />
and referred to as Realistic Disaster Scenarios (RDSs). The Miami Hurricane 5,829 3,280<br />
purpose of this analysis is to utilize these RDSs to provide a Northeast Hurricane 5,287 3,739<br />
reference frame and place into context the model results.<br />
Los Angeles Earthquake 5,375 3,297<br />
Gulf Coast Hurricane 3,730 2,088<br />
However, it is important to note that the specific events used for<br />
Japanese Earthquake 1,109 406<br />
this analysis do not necessarily represent the worst case loss that<br />
European Windstorm 252 89<br />
Japanese Typhoon 177 103<br />
<strong>AIG</strong> <strong>2007</strong> Form 10-K 119


