2007 Annual Report - AIG.com
2007 Annual Report - AIG.com
2007 Annual Report - AIG.com

Create successful ePaper yourself
Turn your PDF publications into a flip-book with our unique Google optimized e-Paper software.
American International Group, Inc. and Subsidiaries<br />
3. Investments<br />
Continued<br />
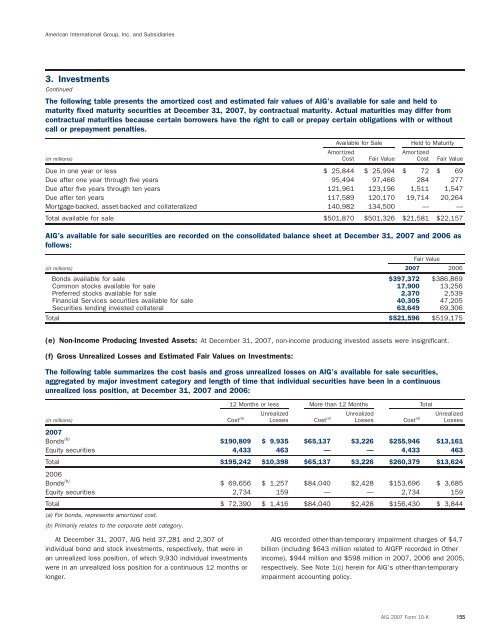
The following table presents the amortized cost and estimated fair values of <strong>AIG</strong>’s available for sale and held to<br />
maturity fixed maturity securities at December 31, <strong>2007</strong>, by contractual maturity. Actual maturities may differ from<br />
contractual maturities because certain borrowers have the right to call or prepay certain obligations with or without<br />
call or prepayment penalties.<br />
Available for Sale Held to Maturity<br />
Amortized<br />
Amortized<br />
(in millions) Cost Fair Value Cost Fair Value<br />
Due in one year or less $ 25,844 $ 25,994 $ 72 $ 69<br />
Due after one year through five years 95,494 97,466 284 277<br />
Due after five years through ten years 121,961 123,196 1,511 1,547<br />
Due after ten years 117,589 120,170 19,714 20,264<br />
Mortgage-backed, asset-backed and collateralized 140,982 134,500 — —<br />
Total available for sale $501,870 $501,326 $21,581 $22,157<br />
<strong>AIG</strong>’s available for sale securities are recorded on the consolidated balance sheet at December 31, <strong>2007</strong> and 2006 as<br />
follows:<br />
Fair Value<br />
(in millions) <strong>2007</strong> 2006<br />
Bonds available for sale $397,372 $386,869<br />
Common stocks available for sale 17,900 13,256<br />
Preferred stocks available for sale 2,370 2,539<br />
Financial Services securities available for sale 40,305 47,205<br />
Securities lending invested collateral 63,649 69,306<br />
Total $521,596 $519,175<br />
(e) Non-In<strong>com</strong>e Producing Invested Assets: At December 31, <strong>2007</strong>, non-in<strong>com</strong>e producing invested assets were insignificant.<br />
(f) Gross Unrealized Losses and Estimated Fair Values on Investments:<br />
The following table summarizes the cost basis and gross unrealized losses on <strong>AIG</strong>’s available for sale securities,<br />
aggregated by major investment category and length of time that individual securities have been in a continuous<br />
unrealized loss position, at December 31, <strong>2007</strong> and 2006:<br />
12 Months or less More than 12 Months Total<br />
Unrealized Unrealized Unrealized<br />
(in millions) Cost (a) Losses Cost (a) Losses Cost (a) Losses<br />
<strong>2007</strong><br />
Bonds (b) $190,809 $ 9,935 $65,137 $3,226 $255,946 $13,161<br />
Equity securities 4,433 463 — — 4,433 463<br />
Total $195,242 $10,398 $65,137 $3,226 $260,379 $13,624<br />
2006<br />
Bonds (b) $ 69,656 $ 1,257 $84,040 $2,428 $153,696 $ 3,685<br />
Equity securities 2,734 159 — — 2,734 159<br />
Total $ 72,390 $ 1,416 $84,040 $2,428 $156,430 $ 3,844<br />
(a) For bonds, represents amortized cost.<br />
(b) Primarily relates to the corporate debt category.<br />
At December 31, <strong>2007</strong>, <strong>AIG</strong> held 37,281 and 2,307 of <strong>AIG</strong> recorded other-than-temporary impairment charges of $4.7<br />
individual bond and stock investments, respectively, that were in billion (including $643 million related to <strong>AIG</strong>FP recorded in Other<br />
an unrealized loss position, of which 9,930 individual investments in<strong>com</strong>e), $944 million and $598 million in <strong>2007</strong>, 2006 and 2005,<br />
were in an unrealized loss position for a continuous 12 months or respectively. See Note 1(c) herein for <strong>AIG</strong>’s other-than-temporary<br />
longer.<br />
impairment accounting policy.<br />
<strong>AIG</strong> <strong>2007</strong> Form 10-K 155