2007 Annual Report - AIG.com
2007 Annual Report - AIG.com
2007 Annual Report - AIG.com

Create successful ePaper yourself
Turn your PDF publications into a flip-book with our unique Google optimized e-Paper software.
FINANCIAL HIGHLIGHTS<br />
(in millions, except per share data and ratios) <strong>2007</strong> 2006 % Change<br />
Net in<strong>com</strong>e (a) $ 6,200 $ 14,048 (55.9)<br />
Net realized capital gains (losses), net of tax (2,386) 33 —<br />
Capital Markets other-than-temporary impairments, net of tax (b) (418) — —<br />
FAS 133 gains (losses), net of tax (304) (1,424) —<br />
Cumulative effect of an accounting change, net of tax — 34 —<br />
Adjusted net in<strong>com</strong>e (c) 9,308 15,405 (39.6)<br />
Net in<strong>com</strong>e, per <strong>com</strong>mon share—diluted 2.39 5.36 (55.4)<br />
Adjusted net in<strong>com</strong>e, per <strong>com</strong>mon share—diluted (c) 3.58 5.88 (39.1)<br />
Book value per <strong>com</strong>mon share 37.87 39.09 (3.1)<br />
Revenues (d)(e)(f) $ 110,064 $ 113,387 (2.9)<br />
Assets 1,060,505 979,410 8.3<br />
Shareholders’ equity 95,801 101,677 (5.8)<br />
General Insurance <strong>com</strong>bined loss and expense ratio 90.33 89.06<br />
General Insurance <strong>com</strong>bined loss and expense ratio, excluding catastrophe losses 89.73 89.06<br />
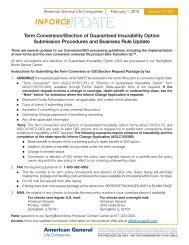
Net In<strong>com</strong>e<br />
(a)<br />
(billions of dollars)<br />
10.5<br />
9.8<br />
8.1<br />
14.0<br />
Net In<strong>com</strong>e per<br />
Common Share—Diluted<br />
(dollars)<br />
3.07<br />
3.73<br />
3.99<br />
5.36<br />
Book Value per Common Share<br />
(dollars)<br />
26.54<br />
30.69<br />
33.24<br />
39.09<br />
37.87<br />
6.2<br />
2.39<br />
2003 2004 2005 2006 <strong>2007</strong><br />
2003 2004 2005 2006 <strong>2007</strong><br />
2003 2004 2005 2006 <strong>2007</strong><br />
(d)(e)(f)<br />
Revenues<br />
( b illions of dollars)<br />
Assets<br />
(billions of dollars)<br />
Shareholders’ Equity<br />
( b illions of dollars)<br />
79.6<br />
97.8<br />
108.8<br />
113.4<br />
110.1<br />
675.6<br />
801.0<br />
853.0<br />
979.4<br />
1,060.5<br />
69.2<br />
79.7<br />
86.3<br />
101.7<br />
95.8<br />
2003 2004 2005 2006 <strong>2007</strong><br />
2003 2004 2005 2006 <strong>2007</strong><br />
2003 2004 2005 2006 <strong>2007</strong><br />
Certain reclassifications have been made to prior period amounts to conform to the current period presentation.<br />
(a) In <strong>2007</strong> and 2006, includes out of period increases (decreases) of $(399) million and $65 million, respectively.<br />
(b) Represents Capital Markets other-than-temporary impairments on securities available for sale.<br />
(c) In <strong>2007</strong> and 2006, includes out of period increases (decreases) of $(261) million and $85 million, respectively.<br />
(d) In <strong>2007</strong> and 2006, includes other-than-temporary impairment charges of $4.7 billion and $944 million, respectively. Also in <strong>2007</strong> and 2006, includes gains (losses) of $(1.44) billion<br />
and $(1.87) billion, respectively, from hedging activities that did not qualify for hedge accounting treatment under FAS 133, including the related foreign exchange gains and losses.<br />
(e) In 2006, includes a $730 million increase in revenue for out of period adjustments related to the accounting for UCITS.<br />
(f) In <strong>2007</strong>, includes an unrealized market valuation loss of $11.5 billion on <strong>AIG</strong>FP's super senior credit default swap portfolio.<br />
<strong>AIG</strong> <strong>2007</strong> <strong>Annual</strong> <strong>Report</strong> 1