Vegetation Classification and Mapping Project Report - USGS
Vegetation Classification and Mapping Project Report - USGS
Vegetation Classification and Mapping Project Report - USGS
Create successful ePaper yourself
Turn your PDF publications into a flip-book with our unique Google optimized e-Paper software.
<strong>Vegetation</strong> <strong>Classification</strong> <strong>and</strong> Distribution <strong>Mapping</strong> <strong>Report</strong>: Petrified Forest National Park<br />
total area <strong>and</strong> frequency of occurrence of<br />
that type within the project area.<br />
The team had planned to sample at the<br />
centroid of each selected polygon. If<br />
the sample site was determined to not<br />
be representative of a homogeneous<br />
vegetation community, the relevé was<br />
moved to the closest representative<br />
vegetation community within the<br />
biophysical unit. A 500-m 2 relevé was<br />
established (1000-m 2 in sparsely vegetated<br />
communities with less than 10% cover),<br />
<strong>and</strong> plant species cover/abundance data, as<br />
well as environmental data, were collected<br />
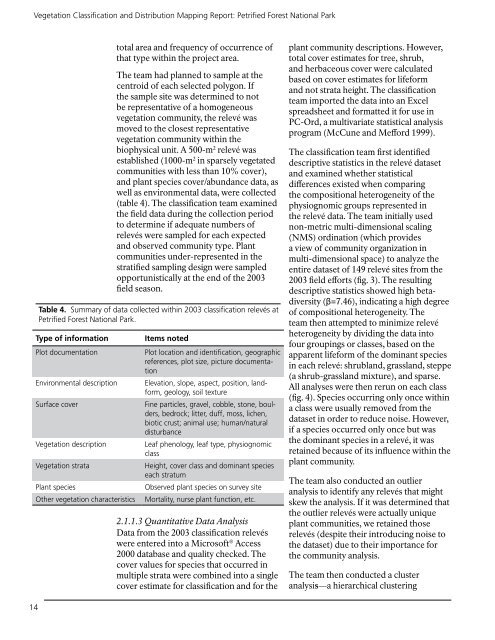
(table 4). The classification team examined<br />
the field data during the collection period<br />
to determine if adequate numbers of<br />
relevés were sampled for each expected<br />
<strong>and</strong> observed community type. Plant<br />
communities under-represented in the<br />
stratified sampling design were sampled<br />
opportunistically at the end of the 2003<br />
field season.<br />
Table 4. Summary of data collected within 2003 classification relevés at<br />
Petrified Forest National Park.<br />
Type of information<br />
Plot documentation<br />
Environmental description<br />
Surface cover<br />
<strong>Vegetation</strong> description<br />
<strong>Vegetation</strong> strata<br />
Plant species<br />
Other vegetation characteristics<br />
Items noted<br />
Plot location <strong>and</strong> identification, geographic<br />
references, plot size, picture documentation<br />
Elevation, slope, aspect, position, l<strong>and</strong>form,<br />
geology, soil texture<br />
Fine particles, gravel, cobble, stone, boulders,<br />
bedrock; litter, duff, moss, lichen,<br />
biotic crust; animal use; human/natural<br />
disturbance<br />
Leaf phenology, leaf type, physiognomic<br />
class<br />
Height, cover class <strong>and</strong> dominant species<br />
each stratum<br />
Observed plant species on survey site<br />
Mortality, nurse plant function, etc.<br />
2.1.1.3 Quantitative Data Analysis<br />
Data from the 2003 classification relevés<br />
were entered into a Microsoft® Access<br />
2000 database <strong>and</strong> quality checked. The<br />
cover values for species that occurred in<br />
multiple strata were combined into a single<br />
cover estimate for classification <strong>and</strong> for the<br />
plant community descriptions. However,<br />
total cover estimates for tree, shrub,<br />
<strong>and</strong> herbaceous cover were calculated<br />
based on cover estimates for lifeform<br />
<strong>and</strong> not strata height. The classification<br />
team imported the data into an Excel<br />
spreadsheet <strong>and</strong> formatted it for use in<br />
PC-Ord, a multivariate statistical analysis<br />
program (McCune <strong>and</strong> Mefford 1999).<br />
The classification team first identified<br />
descriptive statistics in the relevé dataset<br />
<strong>and</strong> examined whether statistical<br />
differences existed when comparing<br />
the compositional heterogeneity of the<br />
physiognomic groups represented in<br />
the relevé data. The team initially used<br />
non-metric multi-dimensional scaling<br />
(NMS) ordination (which provides<br />
a view of community organization in<br />
multi-dimensional space) to analyze the<br />
entire dataset of 149 relevé sites from the<br />
2003 field efforts (fig. 3). The resulting<br />
descriptive statistics showed high betadiversity<br />
(β=7.46), indicating a high degree<br />
of compositional heterogeneity. The<br />
team then attempted to minimize relevé<br />
heterogeneity by dividing the data into<br />
four groupings or classes, based on the<br />
apparent lifeform of the dominant species<br />
in each relevé: shrubl<strong>and</strong>, grassl<strong>and</strong>, steppe<br />
(a shrub-grassl<strong>and</strong> mixture), <strong>and</strong> sparse.<br />
All analyses were then rerun on each class<br />
(fig. 4). Species occurring only once within<br />
a class were usually removed from the<br />
dataset in order to reduce noise. However,<br />
if a species occurred only once but was<br />
the dominant species in a relevé, it was<br />
retained because of its influence within the<br />
plant community.<br />
The team also conducted an outlier<br />
analysis to identify any relevés that might<br />
skew the analysis. If it was determined that<br />
the outlier relevés were actually unique<br />
plant communities, we retained those<br />
relevés (despite their introducing noise to<br />
the dataset) due to their importance for<br />
the community analysis.<br />
The team then conducted a cluster<br />
analysis—a hierarchical clustering<br />
14


