Vegetation Classification and Mapping Project Report - USGS
Vegetation Classification and Mapping Project Report - USGS
Vegetation Classification and Mapping Project Report - USGS

You also want an ePaper? Increase the reach of your titles
YUMPU automatically turns print PDFs into web optimized ePapers that Google loves.
<strong>Vegetation</strong> <strong>Classification</strong> <strong>and</strong> Distribution <strong>Mapping</strong> <strong>Report</strong>: Petrified Forest National Park<br />
Transition zone: An area where the<br />
vegetation composition <strong>and</strong> structure is<br />
intermediate between two associations.<br />
The transition zone may be small as the<br />
associations abruptly change due to a large<br />
shift in the l<strong>and</strong>scape, such as a cliff, or it<br />
may be large as the physical environment<br />
changes gradually. Transition zones often<br />
are challenges to properly classify <strong>and</strong>/or<br />
map vegetation.<br />
United States National Map Accuracy<br />
St<strong>and</strong>ards (NMAS): <strong>USGS</strong> accuracy<br />
st<strong>and</strong>ards for published maps, including<br />
horizontal <strong>and</strong> vertical accuracy, accuracy<br />
testing method, accuracy labeling on<br />
published maps, labeling when a map is<br />
an enlargement of another map, <strong>and</strong> basic<br />
information for map construction as to<br />
latitude <strong>and</strong> longitude boundaries. The<br />
table below shows the st<strong>and</strong>ard for some<br />
common map scales. To meet NMAS<br />
maps must have less than 10 percent of the<br />
points tested (well-defined points) exceed<br />
the st<strong>and</strong>ard. Note that the conversion of<br />
paper maps into digital data usually creates<br />
additional error.<br />
sample from the mapped data actually<br />
represents that category on the ground,<br />
also known as error of commission. This<br />
quantity is computed by dividing the<br />
number of correctly classified samples<br />
by the total number of samples that were<br />
classified as belonging to that category<br />
(Story <strong>and</strong> Congalton 1986). Compare with<br />
producer accuracy.<br />
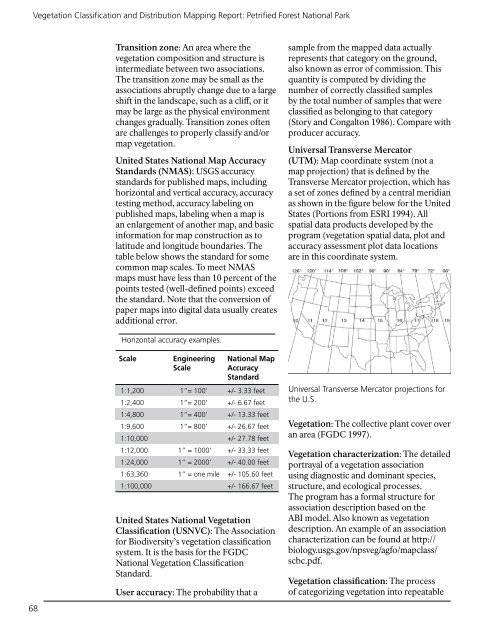
Universal Transverse Mercator<br />
(UTM): Map coordinate system (not a<br />
map projection) that is defined by the<br />
Transverse Mercator projection, which has<br />
a set of zones defined by a central meridian<br />
as shown in the figure below for the United<br />
States (Portions from ESRI 1994). All<br />
spatial data products developed by the<br />
program (vegetation spatial data, plot <strong>and</strong><br />
accuracy assessment plot data locations<br />
are in this coordinate system.<br />
68<br />
Horizontal accuracy examples.<br />
Scale Engineering National Map<br />
Scale Accuracy<br />
St<strong>and</strong>ard<br />
1:1,200 1”= 100’ +/- 3.33 feet<br />
1:2,400 1”= 200’ +/- 6.67 feet<br />
1:4,800 1”= 400’ +/- 13.33 feet<br />
1:9,600 1”= 800’ +/- 26.67 feet<br />
1:10,000 +/- 27.78 feet<br />
1:12,000 1” = 1000’ +/- 33.33 feet<br />
1:24,000 1” = 2000’ +/- 40.00 feet<br />
1:63,360 1” = one mile +/- 105.60 feet<br />
1:100,000 +/- 166.67 feet<br />
United States National <strong>Vegetation</strong><br />
<strong>Classification</strong> (USNVC): The Association<br />
for Biodiversity’s vegetation classification<br />
system. It is the basis for the FGDC<br />
National <strong>Vegetation</strong> <strong>Classification</strong><br />
St<strong>and</strong>ard.<br />
User accuracy: The probability that a<br />
Universal Transverse Mercator projections for<br />
the U.S.<br />
<strong>Vegetation</strong>: The collective plant cover over<br />
an area (FGDC 1997).<br />
<strong>Vegetation</strong> characterization: The detailed<br />
portrayal of a vegetation association<br />
using diagnostic <strong>and</strong> dominant species,<br />
structure, <strong>and</strong> ecological processes.<br />
The program has a formal structure for<br />
association description based on the<br />
ABI model. Also known as vegetation<br />
description. An example of an association<br />
characterization can be found at http://<br />
biology.usgs.gov/npsveg/agfo/mapclass/<br />
scbc.pdf.<br />
<strong>Vegetation</strong> classification: The process<br />
of categorizing vegetation into repeatable