Vegetation Classification and Mapping Project Report - USGS
Vegetation Classification and Mapping Project Report - USGS
Vegetation Classification and Mapping Project Report - USGS

Create successful ePaper yourself
Turn your PDF publications into a flip-book with our unique Google optimized e-Paper software.
Accuracy Assessment <strong>and</strong> Additional Map Classes<br />
4.2 Results<br />
4.2.1 Accuracy Assessment Samples<br />
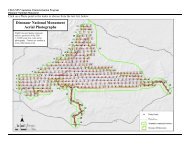
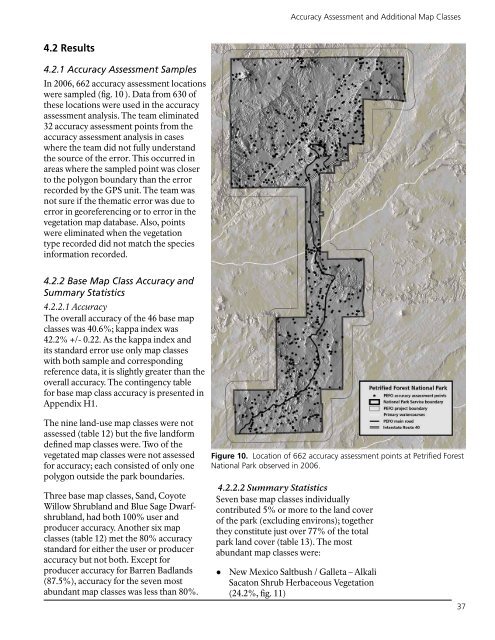
In 2006, 662 accuracy assessment locations<br />
were sampled (fig. 10 ). Data from 630 of<br />
these locations were used in the accuracy<br />
assessment analysis. The team eliminated<br />
32 accuracy assessment points from the<br />
accuracy assessment analysis in cases<br />
where the team did not fully underst<strong>and</strong><br />
the source of the error. This occurred in<br />
areas where the sampled point was closer<br />
to the polygon boundary than the error<br />
recorded by the GPS unit. The team was<br />
not sure if the thematic error was due to<br />
error in georeferencing or to error in the<br />
vegetation map database. Also, points<br />
were eliminated when the vegetation<br />
type recorded did not match the species<br />
information recorded.<br />
4.2.2 Base Map Class Accuracy <strong>and</strong><br />
Summary Statistics<br />
4.2.2.1 Accuracy<br />
The overall accuracy of the 46 base map<br />
classes was 40.6%; kappa index was<br />
42.2% +/- 0.22. As the kappa index <strong>and</strong><br />
its st<strong>and</strong>ard error use only map classes<br />
with both sample <strong>and</strong> corresponding<br />
reference data, it is slightly greater than the<br />
overall accuracy. The contingency table<br />
for base map class accuracy is presented in<br />
Appendix H1.<br />
The nine l<strong>and</strong>-use map classes were not<br />
assessed (table 12) but the five l<strong>and</strong>form<br />
defined map classes were. Two of the<br />
vegetated map classes were not assessed<br />
for accuracy; each consisted of only one<br />
polygon outside the park boundaries.<br />
Three base map classes, S<strong>and</strong>, Coyote<br />
Willow Shrubl<strong>and</strong> <strong>and</strong> Blue Sage Dwarfshrubl<strong>and</strong>,<br />
had both 100% user <strong>and</strong><br />
producer accuracy. Another six map<br />
classes (table 12) met the 80% accuracy<br />
st<strong>and</strong>ard for either the user or producer<br />
accuracy but not both. Except for<br />
producer accuracy for Barren Badl<strong>and</strong>s<br />
(87.5%), accuracy for the seven most<br />
abundant map classes was less than 80%.<br />
Figure 10. Location of 662 accuracy assessment points at Petrified Forest<br />
National Park observed in 2006.<br />
4.2.2.2 Summary Statistics<br />
Seven base map classes individually<br />
contributed 5% or more to the l<strong>and</strong> cover<br />
of the park (excluding environs); together<br />
they constitute just over 77% of the total<br />
park l<strong>and</strong> cover (table 13). The most<br />
abundant map classes were:<br />
● New Mexico Saltbush / Galleta – Alkali<br />
Sacaton Shrub Herbaceous <strong>Vegetation</strong><br />
(24.2%, fig. 11)<br />
37