Vegetation Classification and Mapping Project Report - USGS
Vegetation Classification and Mapping Project Report - USGS
Vegetation Classification and Mapping Project Report - USGS

Create successful ePaper yourself
Turn your PDF publications into a flip-book with our unique Google optimized e-Paper software.
<strong>Vegetation</strong> <strong>Classification</strong> <strong>and</strong> Distribution <strong>Mapping</strong> <strong>Report</strong>: Petrified Forest National Park<br />
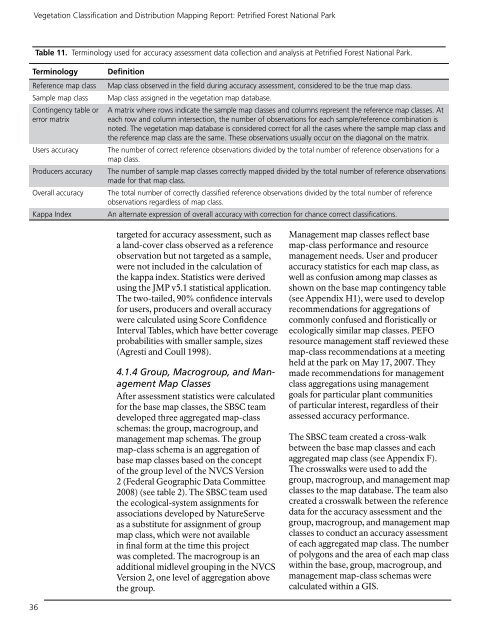
Table 11. Terminology used for accuracy assessment data collection <strong>and</strong> analysis at Petrified Forest National Park.<br />
Terminology<br />
Reference map class<br />
Sample map class<br />
Contingency table or<br />
error matrix<br />
Users accuracy<br />
Producers accuracy<br />
Overall accuracy<br />
Kappa Index<br />
Definition<br />
Map class observed in the field during accuracy assessment, considered to be the true map class.<br />
Map class assigned in the vegetation map database.<br />
A matrix where rows indicate the sample map classes <strong>and</strong> columns represent the reference map classes. At<br />
each row <strong>and</strong> column intersection, the number of observations for each sample/reference combination is<br />
noted. The vegetation map database is considered correct for all the cases where the sample map class <strong>and</strong><br />
the reference map class are the same. These observations usually occur on the diagonal on the matrix.<br />
The number of correct reference observations divided by the total number of reference observations for a<br />
map class.<br />
The number of sample map classes correctly mapped divided by the total number of reference observations<br />
made for that map class.<br />
The total number of correctly classified reference observations divided by the total number of reference<br />
observations regardless of map class.<br />
An alternate expression of overall accuracy with correction for chance correct classifications.<br />
targeted for accuracy assessment, such as<br />
a l<strong>and</strong>-cover class observed as a reference<br />
observation but not targeted as a sample,<br />
were not included in the calculation of<br />
the kappa index. Statistics were derived<br />
using the JMP v5.1 statistical application.<br />
The two-tailed, 90% confidence intervals<br />
for users, producers <strong>and</strong> overall accuracy<br />
were calculated using Score Confidence<br />
Interval Tables, which have better coverage<br />
probabilities with smaller sample, sizes<br />
(Agresti <strong>and</strong> Coull 1998).<br />
4.1.4 Group, Macrogroup, <strong>and</strong> Management<br />
Map Classes<br />
After assessment statistics were calculated<br />
for the base map classes, the SBSC team<br />
developed three aggregated map-class<br />
schemas: the group, macrogroup, <strong>and</strong><br />
management map schemas. The group<br />
map-class schema is an aggregation of<br />
base map classes based on the concept<br />
of the group level of the NVCS Version<br />
2 (Federal Geographic Data Committee<br />
2008) (see table 2). The SBSC team used<br />
the ecological-system assignments for<br />
associations developed by NatureServe<br />
as a substitute for assignment of group<br />
map class, which were not available<br />
in final form at the time this project<br />
was completed. The macrogroup is an<br />
additional midlevel grouping in the NVCS<br />
Version 2, one level of aggregation above<br />
the group.<br />
Management map classes reflect base<br />
map-class performance <strong>and</strong> resource<br />
management needs. User <strong>and</strong> producer<br />
accuracy statistics for each map class, as<br />
well as confusion among map classes as<br />
shown on the base map contingency table<br />
(see Appendix H1), were used to develop<br />
recommendations for aggregations of<br />
commonly confused <strong>and</strong> floristically or<br />
ecologically similar map classes. PEFO<br />
resource management staff reviewed these<br />
map-class recommendations at a meeting<br />
held at the park on May 17, 2007. They<br />
made recommendations for management<br />
class aggregations using management<br />
goals for particular plant communities<br />
of particular interest, regardless of their<br />
assessed accuracy performance.<br />
The SBSC team created a cross-walk<br />
between the base map classes <strong>and</strong> each<br />
aggregated map class (see Appendix F).<br />
The crosswalks were used to add the<br />
group, macrogroup, <strong>and</strong> management map<br />
classes to the map database. The team also<br />
created a crosswalk between the reference<br />
data for the accuracy assessment <strong>and</strong> the<br />
group, macrogroup, <strong>and</strong> management map<br />
classes to conduct an accuracy assessment<br />
of each aggregated map class. The number<br />
of polygons <strong>and</strong> the area of each map class<br />
within the base, group, macrogroup, <strong>and</strong><br />
management map-class schemas were<br />
calculated within a GIS.<br />
36