Vegetation Classification and Mapping Project Report - USGS
Vegetation Classification and Mapping Project Report - USGS
Vegetation Classification and Mapping Project Report - USGS

You also want an ePaper? Increase the reach of your titles
YUMPU automatically turns print PDFs into web optimized ePapers that Google loves.
Accuracy Assessment <strong>and</strong> Additional Map Classes<br />
base. These fine-scale maps allowed each<br />
field team to locate specific polygons on<br />
the ground <strong>and</strong> to visualize the size <strong>and</strong><br />
shape of the polygon they were assessing.<br />
The field team navigated to each site <strong>and</strong><br />
then examined the polygon, using the field<br />
maps as a guide to the polygon’s shape.<br />
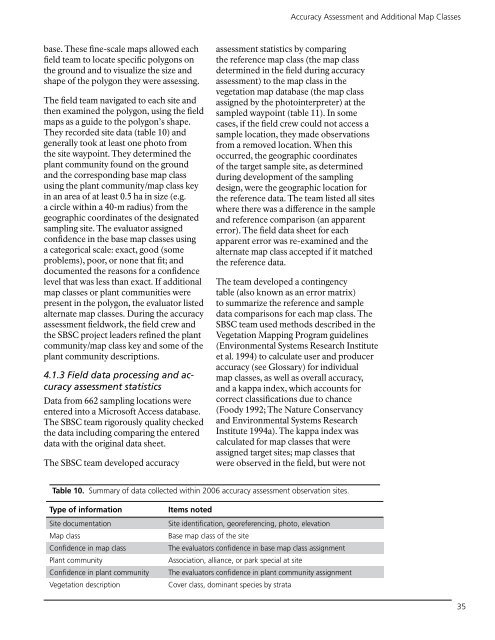
They recorded site data (table 10) <strong>and</strong><br />
generally took at least one photo from<br />
the site waypoint. They determined the<br />
plant community found on the ground<br />
<strong>and</strong> the corresponding base map class<br />
using the plant community/map class key<br />
in an area of at least 0.5 ha in size (e.g.<br />
a circle within a 40-m radius) from the<br />
geographic coordinates of the designated<br />
sampling site. The evaluator assigned<br />
confidence in the base map classes using<br />
a categorical scale: exact, good (some<br />
problems), poor, or none that fit; <strong>and</strong><br />
documented the reasons for a confidence<br />
level that was less than exact. If additional<br />
map classes or plant communities were<br />
present in the polygon, the evaluator listed<br />
alternate map classes. During the accuracy<br />
assessment fieldwork, the field crew <strong>and</strong><br />
the SBSC project leaders refined the plant<br />
community/map class key <strong>and</strong> some of the<br />
plant community descriptions.<br />
4.1.3 Field data processing <strong>and</strong> accuracy<br />
assessment statistics<br />
Data from 662 sampling locations were<br />
entered into a Microsoft Access database.<br />
The SBSC team rigorously quality checked<br />
the data including comparing the entered<br />
data with the original data sheet.<br />
The SBSC team developed accuracy<br />
assessment statistics by comparing<br />
the reference map class (the map class<br />
determined in the field during accuracy<br />
assessment) to the map class in the<br />
vegetation map database (the map class<br />
assigned by the photointerpreter) at the<br />
sampled waypoint (table 11). In some<br />
cases, if the field crew could not access a<br />
sample location, they made observations<br />
from a removed location. When this<br />
occurred, the geographic coordinates<br />
of the target sample site, as determined<br />
during development of the sampling<br />
design, were the geographic location for<br />
the reference data. The team listed all sites<br />
where there was a difference in the sample<br />
<strong>and</strong> reference comparison (an apparent<br />
error). The field data sheet for each<br />
apparent error was re-examined <strong>and</strong> the<br />
alternate map class accepted if it matched<br />
the reference data.<br />
The team developed a contingency<br />
table (also known as an error matrix)<br />
to summarize the reference <strong>and</strong> sample<br />
data comparisons for each map class. The<br />
SBSC team used methods described in the<br />
<strong>Vegetation</strong> <strong>Mapping</strong> Program guidelines<br />
(Environmental Systems Research Institute<br />
et al. 1994) to calculate user <strong>and</strong> producer<br />
accuracy (see Glossary) for individual<br />
map classes, as well as overall accuracy,<br />
<strong>and</strong> a kappa index, which accounts for<br />
correct classifications due to chance<br />
(Foody 1992; The Nature Conservancy<br />
<strong>and</strong> Environmental Systems Research<br />
Institute 1994a). The kappa index was<br />
calculated for map classes that were<br />
assigned target sites; map classes that<br />
were observed in the field, but were not<br />
Table 10. Summary of data collected within 2006 accuracy assessment observation sites.<br />
Type of information<br />
Site documentation<br />
Map class<br />
Confidence in map class<br />
Plant community<br />
Confidence in plant community<br />
<strong>Vegetation</strong> description<br />
Items noted<br />
Site identification, georeferencing, photo, elevation<br />
Base map class of the site<br />
The evaluators confidence in base map class assignment<br />
Association, alliance, or park special at site<br />
The evaluators confidence in plant community assignment<br />
Cover class, dominant species by strata<br />
35