- Page 2 and 3:
This monograph is a reprint of
- Page 5 and 6:
ChernobylConsequences of the Catast
- Page 7 and 8:
viChapter III. Consequences of the
- Page 9 and 10:
viiiFor a long time I have thought
- Page 11 and 12:
CHERNOBYLPrefaceThe principal idea
- Page 13 and 14:
xii• Chapter IV: Radiation Protec
- Page 15 and 16:
CHERNOBYLAcknowledgmentsThe present
- Page 17 and 18:
xviPintchouk, L.B., Institute of Ex
- Page 19 and 20:
2The basic conclusion of the report
- Page 21 and 22:
CHERNOBYLChapter I. Chernobyl Conta
- Page 23 and 24:
6tled outside of Belarus, Ukraine,
- Page 25 and 26:
8TABLE 1.1. Estimations of a Geogra
- Page 27 and 28:
10Figure 1.6. Some of the main area
- Page 29 and 30:
12Figure 1.7. The path of one Chern
- Page 31 and 32:
14Figure 1.10. Reconstruction of co
- Page 33 and 34:
16Figure 1.12. Transuranic radionuc
- Page 35 and 36:
18TABLE 1.3. Radioactive Contaminat
- Page 37 and 38:
20Figure 1.15. Spotty concentration
- Page 39 and 40:
22Figure 1.16. Maps of the Chernoby
- Page 41 and 42:
24the teeth of 6,000 children and f
- Page 43 and 44:
26TABLE 1.8. Estimation of the Popu
- Page 45 and 46:
28observations of fallout from the
- Page 47 and 48:
30Contamination: Chernobyl’s lega
- Page 49 and 50:
CHERNOBYL2. Chernobyl’s Public He
- Page 51 and 52:
34persons who were involved in liqu
- Page 53 and 54:
36the incomplete official data for
- Page 55 and 56:
38periodic journals and magazines a
- Page 57 and 58:
40Chernobyl Forum (2006). Health Ef
- Page 59 and 60:
CHERNOBYL3. General Morbidity, Impa
- Page 61 and 62:
44TABLE 3.2. Frequency of Complaint
- Page 63 and 64:
46Figure 3.2. Number (percentage) o
- Page 65 and 66:
48TABLE 3.7. Percent of “Practica
- Page 67 and 68:
50TABLE 3.12. Disability in Liquida
- Page 69 and 70:
52Gutkovsky, I. A., Kul’kova, L.
- Page 71 and 72:
54prenatally irradiated children. B
- Page 73 and 74:
56encephalopathy in those 40 years
- Page 75 and 76:
CHERNOBYL5. Nonmalignant Diseases a
- Page 77 and 78:
602. Children of liquidators living
- Page 79 and 80:
625.1.2.1. Belarus1. Cardiovascular
- Page 81 and 82:
64blood pressure was characteristic
- Page 83 and 84:
66TABLE 5.4. Incidence of (%, M ±
- Page 85 and 86:
687. For the majority surveyed in t
- Page 87 and 88:
70TABLE 5.12. Chromosomal Mutations
- Page 89 and 90:
72TABLE 5.16. Incidence of Down Syn
- Page 91 and 92:
74mortality; (c) an increase in de
- Page 93 and 94:
76Organization (WHO) (Chernobyl For
- Page 95 and 96:
78Adequate and timely thyroid funct
- Page 97 and 98:
805.3.1.2. Ukraine1. The noticeable
- Page 99 and 100:
82TABLE 5.24. General Endocrine Mor
- Page 101 and 102:
84of cases of autoimmune thyroiditi
- Page 103 and 104:
86between 1992 and 2001 (Moskalenko
- Page 105 and 106:
88protein X concentration in urine,
- Page 107 and 108:
90the 30-km Chernobyl zone. In 1986
- Page 109 and 110:
9211. In the 7 to 9 years after the
- Page 111 and 112:
94Figure 5.7. Chronic bronchitis an
- Page 113 and 114:
96TABLE 5.33. Respiratory Morbidity
- Page 115 and 116:
985.6.2. Ukraine1. Urogenital disea
- Page 117 and 118:
100TABLE 5.36. Urogenital Morbidity
- Page 119 and 120:
102from Chernobyl fallout changed o
- Page 121 and 122:
104TABLE 5.43. Primary Osteomuscula
- Page 123 and 124:
10610. From 1991 to 2000 there was
- Page 125 and 126:
108indicated an almost twofold incr
- Page 127 and 128:
110TABLE 5.49. Dynamics of Nervous
- Page 129 and 130: 1123. SWEDEN. A comprehensive analy
- Page 131 and 132: 1143. In 1991 a group of 512 childr
- Page 133 and 134: 116Only after 2000 did medical auth
- Page 135 and 136: 11819. In 7 to 8 years after the ca
- Page 137 and 138: 120TABLE 5.58. Digestive System Mor
- Page 139 and 140: 122TABLE 5.62. Overall Skin Disease
- Page 141 and 142: 1243. The incidence of kidney infec
- Page 143 and 144: 126TABLE 5.68. Incidence of Congeni
- Page 145 and 146: 128TABLE 5.73. Comparison of the In
- Page 147 and 148: 130TABLE 5.74. Congenital Malformat
- Page 149 and 150: 132Figure 5.15. Typical examples of
- Page 151 and 152: 134TABLE 5.79. Incidence (per 100,0
- Page 153 and 154: 136Arynchyna, N. T. & Mil’kmanovi
- Page 155 and 156: 138Brogger, A., Reitan, J. B., Stra
- Page 157 and 158: 140Drygyna, L. B. (2002). Clinical
- Page 159 and 160: 142Goncharova, R. I. (2000). Remote
- Page 161 and 162: 144September 27-29, 1999, Minsk (Be
- Page 163 and 164: 146Vuazen, K. (Eds.), Pulmonary Sys
- Page 165 and 166: 148June 4-8, 2001, Kiev, Ukraine (A
- Page 167 and 168: 150Noshchenko, A. G. & Loganovsky,
- Page 169 and 170: 152Ukr. Herald Soc. Hygien. Publ. H
- Page 171 and 172: 154Cytogenetic observations of chil
- Page 173 and 174: 156dysfunction in persons sick from
- Page 175 and 176: 158Tytov, L. P. (2002). Early and r
- Page 177 and 178: 160Zaitsev, V. A., Petrenko, S. V.
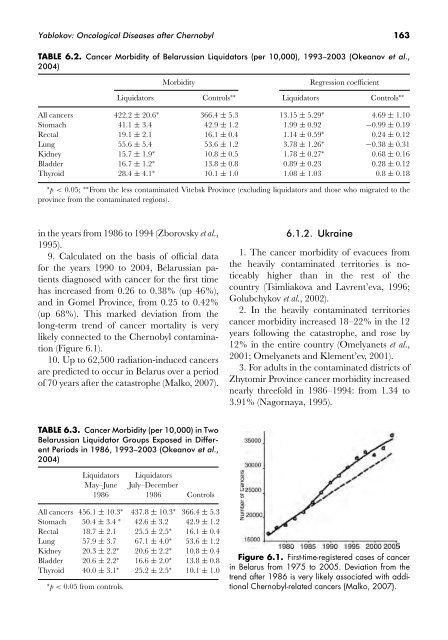
- Page 179: 162that all data from former republ
- Page 183 and 184: 166Figure 6.5. General thyroid canc
- Page 185 and 186: 168Figure 6.7. Thyroid cancer morbi
- Page 187 and 188: 170Figure 6.9. Thyroid cancer morbi
- Page 189 and 190: 172Figure 6.12. Total I-131 contami
- Page 191 and 192: 174Figure 6.16. Papillary thyroid c
- Page 193 and 194: 176well as being a result of the ad
- Page 195 and 196: 178TABLE 6.11. Leukemia Morbidity (
- Page 197 and 198: 180TABLE 6.14. Leukemia Morbidity (
- Page 199 and 200: 182Figure 6.20. Breast cancer morbi
- Page 201 and 202: 184TABLE 6.18. Increase in Morbidit
- Page 203 and 204: 186Busby, C. (1995). The Wings of D
- Page 205 and 206: 188Ivanov, V. K. & Tsyb, A. F. (200
- Page 207 and 208: 190ujf-grenoble.fr/SANTE/alpesmed/e
- Page 209 and 210: CHERNOBYL7. Mortality after the Che
- Page 211 and 212: 194Figure 7.3. Stillbirth rate (per
- Page 213 and 214: 196Figure 7.7. Trends of stillbirth
- Page 215 and 216: 198TABLE 7.1. Increase of the Rate
- Page 217 and 218: 200Figure 7.11. Perinatal mortality
- Page 219 and 220: 202Figure 7.14. Trend of infant mor
- Page 221 and 222: 204Figure 7.19. Trend of mortality
- Page 223 and 224: 206TABLE 7.6. Causes of Death (%) o
- Page 225 and 226: 208TABLE 7.9. Estimates of the Numb
- Page 227 and 228: 210TABLE 7.11. Number of Additional
- Page 229 and 230: 212Buzhievskaya, T. I., Tchaikovska
- Page 231 and 232:
214Law of Ukraine (2006). About Sta
- Page 233 and 234:
216to and 3 years subsequent to the
- Page 235 and 236:
218Figure 1. Absolute number of the
- Page 237 and 238:
220pathology formation, prognosis).
- Page 239 and 240:
222Twenty Years of Chernobyl Catast
- Page 241 and 242:
224TABLE 8.1. Concentration (Bq/m 3
- Page 243 and 244:
226Concentrations of Cs-131/Cs-134/
- Page 245 and 246:
228TABLE 8.6. Coefficients of Accum
- Page 247 and 248:
230Figure 8.2. The annual mean Cs-1
- Page 249 and 250:
232TABLE 8.10. Ground Deposition (k
- Page 251 and 252:
234ReferencesAarkrog, A. (1988). St
- Page 253 and 254:
236pectin-containing food additives
- Page 255 and 256:
238Figure 9.1. Radioautographs of p
- Page 257 and 258:
240TABLE 9.4. Levels of Radionuclid
- Page 259 and 260:
242TABLE 9.6. Inter- and Intraspeci
- Page 261 and 262:
244TABLE 9.8. Intensity of Cs-137 A
- Page 263 and 264:
246each place and time for each ind
- Page 265 and 266:
248TABLE 9.14. Frequency of Some Mo
- Page 267 and 268:
250TABLE 9.20. Change in Anthocyani
- Page 269 and 270:
252Grodzinsky, D. M. (2006). Reflec
- Page 271 and 272:
254after accident. Radiat. Biol. Ra
- Page 273 and 274:
256TABLE 10.1. Maximum Concentratio
- Page 275 and 276:
258Figure 10.2. Individual variabil
- Page 277 and 278:
260TABLE 10.4. Concentration of Som
- Page 279 and 280:
262TABLE 10.7. Some Recorded Cherno
- Page 281 and 282:
264isotope analyses on current and
- Page 283 and 284:
266TABLE 10.12. Abnormalities in La
- Page 285 and 286:
268TABLE 10.16. The Frequency of Do
- Page 287 and 288:
27015. Animals in the Chernobyl zon
- Page 289 and 290:
272TABLE 10.25. Immune Status of th
- Page 291 and 292:
274ReferencesAdamovich, V. L. (1998
- Page 293 and 294:
276Environmental Health (Center for
- Page 295 and 296:
278water bodies. Herald Nat. Belar.
- Page 297 and 298:
280E. V. (1996). Chromosome aberrat
- Page 299 and 300:
282with up to 40 Ci/km 2 (Zymenko e
- Page 301 and 302:
284Luk’yanova, E. M., Denysova, M
- Page 303 and 304:
286demonstrate a return to historic
- Page 305 and 306:
288enterosorbents, and Chapter IV.1
- Page 307 and 308:
290on contaminated foodstuffs avail
- Page 309 and 310:
292Figure 12.1. Countrywide mean co
- Page 311 and 312:
294TABLE 12.5. Concentration (pCi/l
- Page 313 and 314:
296TABLE 12.7. Cs-137 Body Burden i
- Page 315 and 316:
298Figure 12.5. Average specific ac
- Page 317 and 318:
300Figure 12.10. Body burden of Cs-
- Page 319 and 320:
302Omelyanets, N. I. (2001). Radioe
- Page 321 and 322:
304formation. The additives prevent
- Page 323 and 324:
306TABLE 13.2. EKG Normalization Re
- Page 325 and 326:
308increased sense of personal resp
- Page 327 and 328:
310Nesterenko, V. B. (2005). Radiat
- Page 329 and 330:
312require a separate monograph. Th
- Page 331 and 332:
3141. In the exclusion zone, which
- Page 333 and 334:
316Foods rich in K include potatoes
- Page 335 and 336:
CHERNOBYL15. Consequences of the Ch
- Page 337 and 338:
320• Inadequacy of modern knowled
- Page 339 and 340:
322with illnesses characteristic of
- Page 341 and 342:
324Chernobyl-contaminated areas, ra
- Page 343 and 344:
326information which can be unwante


