- Page 1:
Barts Health Equality andHuman Righ
- Page 5 and 6:
Barts Health Equality and Human Rig
- Page 8 and 9:
www.brap.org.ukGLOSSARYBMECAGCCGCQC
- Page 10 and 11:
www.brap.org.uksince the availabili
- Page 12 and 13:
www.brap.org.ukstroke patients with
- Page 14 and 15:
www.brap.org.ukin all three Trusts
- Page 16 and 17:
www.brap.org.ukissues in more depth
- Page 19 and 20:
Barts Health Equality and Human Rig
- Page 21 and 22:
Barts Health Equality and Human Rig
- Page 23 and 24:
Barts Health Equality and Human Rig
- Page 25 and 26:
Barts Health Equality and Human Rig
- Page 27 and 28:
Barts Health Equality and Human Rig
- Page 29:
Barts Health Equality and Human Rig
- Page 32 and 33:
www.brap.org.ukFigure 2.1.1b: Staff
- Page 34 and 35:
www.brap.org.ukObviously, this pres
- Page 36 and 37:
www.brap.org.uk2.1.4 SexAll three T
- Page 38 and 39:
www.brap.org.ukWhipps Cross2.1.7 Pr
- Page 40 and 41:
www.brap.org.uk2.1.9 Sexual orienta
- Page 42 and 43:
www.brap.org.ukFigure 2.2.1: Staff
- Page 44 and 45:
www.brap.org.ukWorkforce (Equalitie
- Page 46 and 47:
www.brap.org.ukFigure 2.2.4a: Staff
- Page 48 and 49:
www.brap.org.ukexperiences of discr
- Page 50 and 51:
www.brap.org.ukFigure 3.2.1: % of s
- Page 52 and 53:
www.brap.org.uk3.3 Experience of ha
- Page 54 and 55:
www.brap.org.uk3.3.4 SexRates of ha
- Page 56 and 57:
www.brap.org.uk3.4.2 DisabilityIt i
- Page 58 and 59:
www.brap.org.ukFigure 3.4.4: Discip
- Page 60 and 61:
www.brap.org.ukFigure 3.4.7: Discip
- Page 62 and 63: www.brap.org.uk3.5.2 DisabilityFigu
- Page 64 and 65: www.brap.org.uk3.5.5 Religion and b
- Page 66 and 67: www.brap.org.ukFigure 4.1.1a: Promo
- Page 68 and 69: www.brap.org.ukFigure 4.1.3b: Promo
- Page 70 and 71: www.brap.org.ukFigure 4.1.5a: Promo
- Page 72 and 73: www.brap.org.ukFigure 4.2.1: Receip
- Page 74 and 75: www.brap.org.uk4.3 Detriments and d
- Page 76 and 77: www.brap.org.ukFigure 4.3.3: Detrim
- Page 78 and 79: www.brap.org.uk5. RECRUITMENTThe da
- Page 80 and 81: www.brap.org.ukFigure 5.1.3: Applic
- Page 82 and 83: www.brap.org.ukFigure 5.3.1a: Appli
- Page 84 and 85: www.brap.org.ukFigure 5.3.2: Starte
- Page 86 and 87: www.brap.org.ukFigure 5.4.1: Applic
- Page 88 and 89: EN5EN6EN4EN2EN1www.brap.org.ukEN7EN
- Page 90 and 91: www.brap.org.ukAs figures 2a-d belo
- Page 92 and 93: www.brap.org.ukFigure 2c: Age-sex d
- Page 94 and 95: www.brap.org.ukForest. The particul
- Page 96 and 97: www.brap.org.ukProviding data relat
- Page 98 and 99: www.brap.org.ukd: Merged figuresSou
- Page 100 and 101: www.brap.org.ukFigure 3.3a: Proport
- Page 102 and 103: www.brap.org.uk3.4 Migrant populati
- Page 104 and 105: www.brap.org.ukFigure 4b: Number of
- Page 106 and 107: www.brap.org.ukFigure 4f: Projected
- Page 108 and 109: www.brap.org.uk6. Sexual orientatio
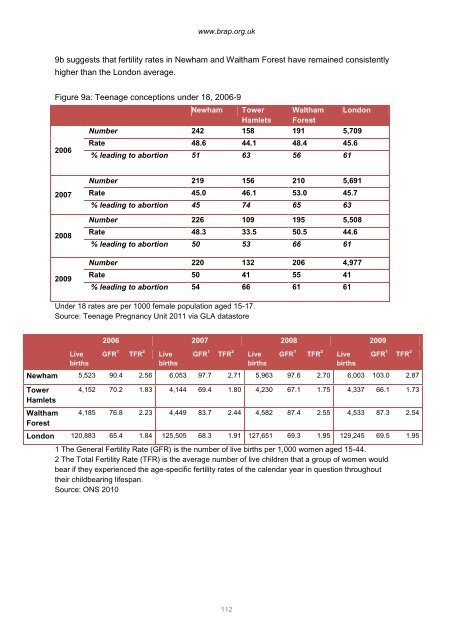
- Page 110 and 111: www.brap.org.ukAgainst this, howeve
- Page 114 and 115: www.brap.org.ukFigure 11: Levels of
- Page 116 and 117: www.brap.org.uk14. Jobs DensityJobs
- Page 118 and 119: www.brap.org.uk16. Child PovertyThe
- Page 120 and 121: www.brap.org.ukIV. HEALTH INEQUALIT
- Page 122 and 123: www.brap.org.ukSource: Husbands, S.
- Page 124 and 125: Key: Newham (N), Tower Hamlets (TH)
- Page 126 and 127: Healthissue/conditionTuberculosisRa
- Page 128 and 129: Healthissue/conditionHIVProtectedch
- Page 130 and 131: Healthissue/conditionCardiovascular
- Page 132 and 133: Healthissue/conditionMentalhealthPr
- Page 134 and 135: Healthissue/conditionLifestyle(obes
- Page 136 and 137: Healthissue/conditionProtectedchara
- Page 138 and 139: Healthissue/conditionProtectedchara
- Page 140 and 141: Healthissue/conditionProtectedchara
- Page 142 and 143: Healthissue/conditionProtectedchara
- Page 144 and 145: www.brap.org.uk3. INEQUALITIES IN E
- Page 146 and 147: www.brap.org.ukFigure 3.1.1b: % of
- Page 148 and 149: www.brap.org.ukweren’t there at l
- Page 150 and 151: www.brap.org.ukPart B: Experience o
- Page 152 and 153: www.brap.org.ukThese discrepancies
- Page 154 and 155: www.brap.org.ukFigure 4.2b: no. of
- Page 156 and 157: www.brap.org.ukSECTION 2:LOCALSTAKE
- Page 158 and 159: www.brap.org.ukviews about the broa
- Page 160 and 161: www.brap.org.ukthat professionals w
- Page 162 and 163:
www.brap.org.ukthat there weren’t
- Page 164 and 165:
www.brap.org.ukPatient experience/h
- Page 166 and 167:
www.brap.org.ukSummaryAs with other
- Page 168 and 169:
www.brap.org.ukEthnictyDisabilitySe
- Page 170 and 171:
www.brap.org.ukGroupMuch Harderto A
- Page 172 and 173:
www.brap.org.ukGroupMuch Harder toA
- Page 174 and 175:
www.brap.org.ukOf those who didn’
- Page 176 and 177:
www.brap.org.ukpeople should not be
- Page 178 and 179:
www.brap.org.ukCorrelation between
- Page 180 and 181:
www.brap.org.ukPeople should be tre
- Page 182 and 183:
www.brap.org.ukAs before, participa
- Page 184 and 185:
www.brap.org.ukHealth inequalities
- Page 186 and 187:
www.brap.org.uk3.3.2 Reach of exist
- Page 188 and 189:
www.brap.org.ukSECTION 3:EQUALITYAN
- Page 190 and 191:
www.brap.org.ukIt should be noted t
- Page 192 and 193:
Merger issuePositiveimplicationsof
- Page 194 and 195:
Merger issuePositiveimplicationsof
- Page 196 and 197:
Merger issuePositiveimplicationsof
- Page 198 and 199:
EDS Goal 2: Improved Patient Access
- Page 200 and 201:
Merger issuePositive implicationsof
- Page 202 and 203:
Merger issuePositiveimplications of
- Page 204 and 205:
EDS Goal 4: Inclusive Leadership at
- Page 206 and 207:
Merger issuePositive implicationsof
- Page 208 and 209:
Merger issuePositive implicationsof
- Page 210 and 211:
www.brap.org.uk4. Conclusions and r
- Page 212 and 213:
www.brap.org.ukquality of provision
- Page 214 and 215:
www.brap.org.ukStep 3Designing appr