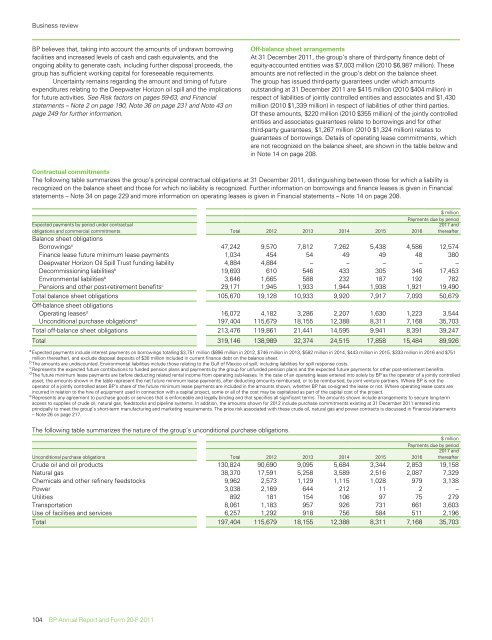
Business review<strong>BP</strong> believes that, taking into account the amounts of undrawn borrowingfacilities <strong>and</strong> increased levels of cash <strong>and</strong> cash equivalents, <strong>and</strong> theongoing ability to generate cash, including further disposal proceeds, thegroup has sufficient working capital for foreseeable requirements.Uncertainty remains regarding the amount <strong>and</strong> timing of futureexpenditures relating to the Deepwater Horizon oil spill <strong>and</strong> the implicationsfor future activities. See Risk factors on pages 59-63, <strong>and</strong> Financialstatements – Note 2 on page 190, Note 36 on page 231 <strong>and</strong> Note 43 onpage 249 for further information.Off-balance sheet arrangementsAt 31 December <strong>20</strong>11, the group’s share of third-party finance debt ofequity-accounted entities was $7,003 million (<strong>20</strong>10 $6,987 million). Theseamounts are not reflected in the group’s debt on the balance sheet.The group has issued third-party guarantees under which amountsoutst<strong>and</strong>ing at 31 December <strong>20</strong>11 are $415 million (<strong>20</strong>10 $404 million) inrespect of liabilities of jointly controlled entities <strong>and</strong> associates <strong>and</strong> $1,430million (<strong>20</strong>10 $1,339 million) in respect of liabilities of other third parties.Of these amounts, $2<strong>20</strong> million (<strong>20</strong>10 $355 million) of the jointly controlledentities <strong>and</strong> associates guarantees relate to borrowings <strong>and</strong> for otherthird-party guarantees, $1,267 million (<strong>20</strong>10 $1,324 million) relates toguarantees of borrowings. Details of operating lease commitments, whichare not recognized on the balance sheet, are shown in the table below <strong>and</strong>in Note 14 on page <strong>20</strong>8.Contractual commitmentsThe following table summarizes the group’s principal contractual obligations at 31 December <strong>20</strong>11, distinguishing between those for which a liability isrecognized on the balance sheet <strong>and</strong> those for which no liability is recognized. Further information on borrowings <strong>and</strong> finance leases is given in Financialstatements – Note 34 on page 229 <strong>and</strong> more information on operating leases is given in Financial statements – Note 14 on page <strong>20</strong>8.$ millionPayments due by periodExpected payments by period under contractualobligations <strong>and</strong> commercial commitments Total <strong>20</strong>12 <strong>20</strong>13 <strong>20</strong>14 <strong>20</strong>15 <strong>20</strong>16<strong>20</strong>17 <strong>and</strong>thereafterBalance sheet obligationsBorrowings a 47,242 9,570 7,812 7,262 5,438 4,586 12,574Finance lease future minimum lease payments 1,034 454 54 49 49 48 380Deepwater Horizon Oil Spill Trust funding liability 4,884 4,884 – – – – –Decommissioning liabilities b 19,693 610 546 433 305 346 17,453Environmental liabilities b 3,646 1,665 588 232 187 192 782Pensions <strong>and</strong> other post-retirement benefits c 29,171 1,945 1,933 1,944 1,938 1,921 19,490Total balance sheet obligations 105,670 19,128 10,933 9,9<strong>20</strong> 7,917 7,093 50,679Off-balance sheet obligationsOperating leases d 16,072 4,182 3,286 2,<strong>20</strong>7 1,630 1,223 3,544Unconditional purchase obligations e 197,404 115,679 18,155 12,388 8,311 7,168 35,703Total off-balance sheet obligations 213,476 119,861 21,441 14,595 9,941 8,391 39,247Total 319,146 138,989 32,374 24,515 17,858 15,484 89,926a Expected payments include interest payments on borrowings totalling $3,751 million ($896 million in <strong>20</strong>12, $746 million in <strong>20</strong>13, $582 million in <strong>20</strong>14, $443 million in <strong>20</strong>15, $333 million in <strong>20</strong>16 <strong>and</strong> $751million thereafter), <strong>and</strong> exclude disposal deposits of $30 million included in current finance debt on the balance sheet.b The amounts are undiscounted. Environmental liabilities include those relating to the Gulf of Mexico oil spill, including liabilities for spill response costs.c Represents the expected future contributions to funded pension plans <strong>and</strong> payments by the group for unfunded pension plans <strong>and</strong> the expected future payments for other post-retirement benefits.d The future minimum lease payments are before deducting related rental income from operating sub-leases. In the case of an operating lease entered into solely by <strong>BP</strong> as the operator of a jointly controlledasset, the amounts shown in the table represent the net future minimum lease payments, after deducting amounts reimbursed, or to be reimbursed, by joint venture partners. Where <strong>BP</strong> is not theoperator of a jointly controlled asset <strong>BP</strong>’s share of the future minimum lease payments are included in the amounts shown, whether <strong>BP</strong> has co-signed the lease or not. Where operating lease costs areincurred in relation to the hire of equipment used in connection with a capital project, some or all of the cost may be capitalized as part of the capital cost of the project.e Represents any agreement to purchase goods or services that is enforceable <strong>and</strong> legally binding <strong>and</strong> that specifies all significant terms. The amounts shown include arrangements to secure long-termaccess to supplies of crude oil, natural gas, feedstocks <strong>and</strong> pipeline systems. In addition, the amounts shown for <strong>20</strong>12 include purchase commitments existing at 31 December <strong>20</strong>11 entered intoprincipally to meet the group’s short-term manufacturing <strong>and</strong> marketing requirements. The price risk associated with these crude oil, natural gas <strong>and</strong> power contracts is discussed in Financial statements– Note 26 on page 217.The following table summarizes the nature of the group’s unconditional purchase obligations.$ millionPayments due by period<strong>20</strong>17 <strong>and</strong>Unconditional purchase obligations Total <strong>20</strong>12 <strong>20</strong>13 <strong>20</strong>14 <strong>20</strong>15 <strong>20</strong>16 thereafterCrude oil <strong>and</strong> oil products 130,824 90,690 9,095 5,684 3,344 2,853 19,158Natural gas 38,370 17,591 5,258 3,589 2,516 2,087 7,329Chemicals <strong>and</strong> other refinery feedstocks 9,962 2,573 1,129 1,115 1,028 979 3,138Power 3,038 2,169 644 212 11 2 –Utilities 892 181 154 106 97 75 279Transportation 8,061 1,183 957 926 731 661 3,603Use of facilities <strong>and</strong> services 6,257 1,292 918 756 584 511 2,196Total 197,404 115,679 18,155 12,388 8,311 7,168 35,703104 <strong>BP</strong> <strong>Annual</strong> <strong>Report</strong> <strong>and</strong> <strong>Form</strong> <strong>20</strong>-F <strong>20</strong>11
Business reviewThe group expects its total capital expenditure, excluding acquisitions <strong>and</strong> asset exchanges, to be around $22 billion in <strong>20</strong>12. The following tablesummarizes the group’s capital expenditure commitments for property, plant <strong>and</strong> equipment at 31 December <strong>20</strong>11 <strong>and</strong> the proportion of that expenditurefor which contracts have been placed. Capital expenditure is considered to be committed when the project has received the appropriate level of internalmanagement approval. For jointly controlled assets, the net <strong>BP</strong> share is included in the amounts shown. Where operating lease costs are incurred inconnection with a capital project, some or all of the cost may be capitalized as part of the capital cost of the project. Such costs are included in theamounts shown.$ millionCapital expenditure commitments Total <strong>20</strong>12 <strong>20</strong>13 <strong>20</strong>14 <strong>20</strong>15 <strong>20</strong>16<strong>20</strong>17 <strong>and</strong>thereafterCommitted on major projects 32,951 15,113 7,443 4,268 2,828 1,535 1,764Amounts for which contracts have been placed 12,517 7,689 2,789 1,094 511 315 119In addition, at 31 December <strong>20</strong>11, the group had committed to capital expenditure relating to investments in equity-accounted entities amounting to $610million. Contracts were in place for $332 million of this total.Cash flowThe following table summarizes the group’s cash flows.$ million<strong>20</strong>11 <strong>20</strong>10 <strong>20</strong>09Net cash provided by operating activities 22,154 13,616 27,716Net cash (used in) investing activities (26,633) (3,960) (18,133)Net cash provided by (used in) financingactivities 482 840 (9,551)Currency translation differences relatingto cash <strong>and</strong> cash equivalents (492) (279) 110Increase (decrease) in cash <strong>and</strong> cashequivalents (4,489) 10,217 142Cash <strong>and</strong> cash equivalents at beginningof year 18,556 8,339 8,197Cash <strong>and</strong> cash equivalents at end of year 14,067 18,556 8,339Net cash provided by operating activities for the year ended 31 December<strong>20</strong>11 was $22,154 million compared with $13,616 million for <strong>20</strong>10, theincrease primarily reflecting a reduction in the cash outflow in respect ofthe Gulf of Mexico oil spill from $16,019 million in <strong>20</strong>10 to $6,813 millionin <strong>20</strong>11. Excluding the impacts of the Gulf of Mexico oil spill, net cashprovided by operating activities was $28,967 million for <strong>20</strong>11, compared to$29,635 million for <strong>20</strong>10, a decrease of $668 million. Profit before taxationdecreased by $1,018 million, working capital requirements increased by$1,509 million <strong>and</strong> income taxes paid increased by $1,879 million. Theseimpacts were partially offset by a decrease of $2,622 million in the netimpairment, gains <strong>and</strong> losses on sale of businesses <strong>and</strong> fixed assets,<strong>and</strong> an increase in dividends received from jointly controlled entities <strong>and</strong>associates of $2,104 million.Net cash provided by operating activities for the year ended31 December <strong>20</strong>10 was $13,616 million compared with $27,716 millionfor <strong>20</strong>09, the reduction primarily reflecting a net cash outflow of $16,019million in respect of the Gulf of Mexico oil spill. Excluding the impacts ofthe Gulf of Mexico oil spill, profit before taxation increased by $10,986million <strong>and</strong> a decrease in working capital requirements contributed $842million. This higher profit before tax did not result in an equivalent netincrease in operating cash flow because it included $4,854 million innet gains on disposals, net of impairments, a decrease of $1,160 millionin depreciation, depletion, amortization <strong>and</strong> exploration expense, <strong>and</strong> adecrease of $787 million in the net charge for provisions, less payments, allof which are non-cash items.Net cash used in investing activities was $26,633 million in <strong>20</strong>11,compared with $3,960 million <strong>and</strong> $18,133 million in <strong>20</strong>10 <strong>and</strong> <strong>20</strong>09respectively. The increase in cash used in <strong>20</strong>11 reflected a decreaseof $14,222 million in disposal proceeds, including the impact of therepayment in <strong>20</strong>11 of a $3,530 million disposal deposit received in <strong>20</strong>10,following the termination of the Pan American Energy LLC sale agreement,<strong>and</strong> an increase of $8,441 million in acquisitions, net of cash acquired; ofwhich $7.0 billion was for the Reliance transaction. The decrease in <strong>20</strong>10compared with <strong>20</strong>09 reflected an increase of $14,273 million in disposalproceeds <strong>and</strong> a decrease in capital expenditure <strong>and</strong> investments of $2,445million, partly offset by an increase in acquisitions of $2,469 million.Net cash provided by financing activities was $482 million in <strong>20</strong>11compared with $840 million net cash provided in <strong>20</strong>10 <strong>and</strong> $9,551 millionnet cash used in <strong>20</strong>09. The decrease in net cash provided in <strong>20</strong>11 primarilyreflected a decrease in net proceeds from long-term financing of $4,734million, <strong>and</strong> an increase in dividends paid of $1,445 million partly offset by anet increase in short-term debt of $5,846 million. The net increase in cashprovided in <strong>20</strong>10 compared with <strong>20</strong>09 reflected a decrease in dividendspaid of $7,957 million, an increase in net proceeds from long-term financingof $1,686 million <strong>and</strong> a decrease in net repayments of short-term debt of$786 million.The group has had significant levels of capital investment for manyyears. Cash flow in respect of capital investment, excluding acquisitions,was $18.8 billion in <strong>20</strong>11, $18.9 billion in <strong>20</strong>10 <strong>and</strong> $21.4 billion in <strong>20</strong>09.Sources of funding are completely fungible, but the majority of the group’sfunding requirements for new investment come from cash generated byexisting operations. The group’s level of net debt, that is debt less cash <strong>and</strong>cash equivalents, was $29.0 billion at the end of <strong>20</strong>11, $25.9 billion at theend of <strong>20</strong>10 <strong>and</strong> $26.2 billion at the end of <strong>20</strong>09.During the period <strong>20</strong>09 to <strong>20</strong>11, our total sources of cash amountedto $87 billion, while our total uses of cash amounted to $90 billion. The netcash usage of $3 billion, <strong>and</strong> the increase in cash <strong>and</strong> cash equivalents heldof $6 billion, were financed by an increase in finance debt of $9 billion overthe three-year period. During this period, the price of Brent crude oil hasaveraged $84.14 per barrel. The following table summarizes the three-yearsources <strong>and</strong> uses of cash.$ billionSources of cashNet cash provided by operating activities 63Disposals 2487Uses of cashCapital expenditure 59Acquisitions 13Net repurchase of shares –Dividends paid to <strong>BP</strong> shareholders 17Dividends paid to minority interests 190Net use of cash (3)Increase in finance debt 9Increase in cash <strong>and</strong> cash equivalents 6Disposal proceeds received during the three-year period exceeded cashused for acquisitions, as a result in particular of our ongoing disposalprogramme started in <strong>20</strong>10. Net investment (capital expenditure <strong>and</strong>acquisitions less disposal proceeds) during this period averaged $16 billionper year. Dividends paid to <strong>BP</strong> shareholders totalled $17 billion during thethree-year period, with no ordinary share dividends being paid in respectof the first three quarters of <strong>20</strong>10. In the past three years, $4 billion hasbeen contributed to funded pension plans. This is reflected in net cashprovided by operating activities in the table above. The balance of cash <strong>and</strong>cash equivalents held has been increased in light of the group’s currentcircumstances, as noted above.Business review: <strong>BP</strong> in more depth<strong>BP</strong> <strong>Annual</strong> <strong>Report</strong> <strong>and</strong> <strong>Form</strong> <strong>20</strong>-F <strong>20</strong>11 105
- Page 2 and 3:
Cover imagePhotograph of DeepseaSta
- Page 4 and 5:
Cross reference to Form 20-FPageIte
- Page 6 and 7:
Miscellaneous termsIn this document
- Page 8 and 9:
6 BP Annual Report and Form 20-F 20
- Page 10:
Chairman’s letterCarl-Henric Svan
- Page 13 and 14:
During the year, the remuneration c
- Page 15 and 16:
Business review: Group overviewBP A
- Page 17 and 18:
SafetyDuring the year, we reorganiz
- Page 19 and 20:
In Refining and Marketing, our worl
- Page 21 and 22:
Crude oil and gas prices,and refini
- Page 23:
In detailFor more information, seeR
- Page 26 and 27:
Our market: Longer-term outlookThe
- Page 29 and 30:
BP’s distinctive capabilities and
- Page 31 and 32:
Technology will continue to play a
- Page 33 and 34:
In detailFor more information,see C
- Page 35 and 36:
In detailFind out more online.bp.co
- Page 37 and 38:
BP Annual Report and Form 20-F 2011
- Page 39 and 40:
Below BP has asignificant presencei
- Page 41 and 42:
What you can measure6 Active portfo
- Page 43 and 44:
Business review: Group overview2012
- Page 45 and 46:
Our risk management systemOur enhan
- Page 47 and 48:
Our current strategic priorities ar
- Page 49 and 50:
Our performance2011 was a year of f
- Page 51 and 52:
Left BP employeesat work in Prudhoe
- Page 53 and 54:
We continued to sell non-core asset
- Page 55 and 56: Reported recordableinjury frequency
- Page 57 and 58: Business reviewBP in more depth56 F
- Page 59 and 60: Business reviewThe primary addition
- Page 61 and 62: Business reviewRisk factorsWe urge
- Page 63 and 64: Business review2010. Similar action
- Page 65 and 66: Business reviewBusiness continuity
- Page 67: Business reviewSafetyOver the past
- Page 70: Business reviewour review of all th
- Page 73 and 74: Business reviewGreenhouse gas regul
- Page 75 and 76: Business reviewresources such as dr
- Page 77 and 78: Business reviewExploration and Prod
- Page 79 and 80: Business reviewCompleting the respo
- Page 81 and 82: Business reviewgrants, which were s
- Page 83 and 84: Business reviewOur performanceKey s
- Page 85 and 86: Business reviewwere in Russia (Oren
- Page 87 and 88: Business reviewCanadaIn Canada, BP
- Page 89 and 90: Business review• In March 2011, T
- Page 91 and 92: Business reviewaccess advantageous
- Page 93 and 94: Business reviewBP’s vice presiden
- Page 95 and 96: Business reviewhttp://www.bp.com/do
- Page 97 and 98: Business reviewbalance of participa
- Page 99 and 100: Business reviewAcquisitions and dis
- Page 101 and 102: Business reviewLPGOur global LPG ma
- Page 103 and 104: Business reviewOther businesses and
- Page 105: Business reviewLiquidity and capita
- Page 109 and 110: Business reviewFrequently, work (in
- Page 111 and 112: Business reviewHazardous and Noxiou
- Page 113 and 114: Business reviewpart of a larger por
- Page 115 and 116: Directors andsenior management114 D
- Page 117 and 118: Directors and senior managementDire
- Page 119 and 120: Directors and senior managementH L
- Page 121 and 122: Corporate governanceCorporate gover
- Page 123 and 124: Corporate governanceAntony Burgmans
- Page 125 and 126: Corporate governanceBoard oversight
- Page 127 and 128: Corporate governanceBoard and commi
- Page 129 and 130: Corporate governancefinancial repor
- Page 131 and 132: Corporate governancechairs and secr
- Page 133 and 134: Corporate governance• Oversee GCR
- Page 135 and 136: Corporate governanceCommittee’s r
- Page 137 and 138: Corporate governanceControls and pr
- Page 139 and 140: Corporate governanceThe Act require
- Page 141 and 142: Directors’ remuneration reportRem
- Page 143 and 144: Directors’ remuneration reportSum
- Page 145 and 146: Directors’ remuneration reportSaf
- Page 147 and 148: Directors’ remuneration reportRem
- Page 149 and 150: Directors’ remuneration reportThe
- Page 151 and 152: Directors’ remuneration reportSha
- Page 153 and 154: Directors’ remuneration reportNon
- Page 155 and 156: Additional informationfor sharehold
- Page 157 and 158:
Additional information for sharehol
- Page 159 and 160:
Additional information for sharehol
- Page 161 and 162:
Additional information for sharehol
- Page 163 and 164:
Additional information for sharehol
- Page 165 and 166:
Additional information for sharehol
- Page 167 and 168:
Additional information for sharehol
- Page 169 and 170:
Additional information for sharehol
- Page 171 and 172:
Additional information for sharehol
- Page 173 and 174:
Additional information for sharehol
- Page 175 and 176:
Financial statements174 Statement o
- Page 177 and 178:
Consolidated financial statements o
- Page 179 and 180:
Consolidated financial statements o
- Page 181 and 182:
Consolidated financial statements o
- Page 183 and 184:
Consolidated financial statements o
- Page 185 and 186:
Notes on financial statements1. Sig
- Page 187 and 188:
Notes on financial statements1. Sig
- Page 189 and 190:
Notes on financial statements1. Sig
- Page 191 and 192:
Notes on financial statements1. Sig
- Page 193 and 194:
Notes on financial statementshttp:/
- Page 195 and 196:
Notes on financial statementshttp:/
- Page 197 and 198:
Notes on financial statements3. Bus
- Page 199 and 200:
Notes on financial statements5. Dis
- Page 201 and 202:
Notes on financial statements5. Dis
- Page 203 and 204:
Notes on financial statementshttp:/
- Page 205 and 206:
Notes on financial statementshttp:/
- Page 207 and 208:
Notes on financial statements7. Int
- Page 209 and 210:
Notes on financial statements10. Im
- Page 211 and 212:
Notes on financial statements15. Ex
- Page 213 and 214:
Notes on financial statementshttp:/
- Page 215 and 216:
Notes on financial statementshttp:/
- Page 217 and 218:
Notes on financial statementshttp:/
- Page 219 and 220:
Notes on financial statements26. Fi
- Page 221 and 222:
Notes on financial statements26. Fi
- Page 223 and 224:
Notes on financial statements26. Fi
- Page 225 and 226:
Notes on financial statements29. Tr
- Page 227 and 228:
Notes on financial statements33. De
- Page 229 and 230:
Notes on financial statements33. De
- Page 231 and 232:
Notes on financial statements34. Fi
- Page 233 and 234:
Notes on financial statementshttp:/
- Page 235 and 236:
Notes on financial statements36. Pr
- Page 237 and 238:
Notes on financial statements37. Pe
- Page 239 and 240:
Notes on financial statements37. Pe
- Page 241 and 242:
Notes on financial statements37. Pe
- Page 243 and 244:
Notes on financial statements38. Ca
- Page 245 and 246:
Notes on financial statementsTotal
- Page 247 and 248:
Notes on financial statements39. Ca
- Page 249 and 250:
Notes on financial statements40. Sh
- Page 251 and 252:
Notes on financial statements42. Re
- Page 253 and 254:
Notes on financial statements45. Su
- Page 255 and 256:
Notes on financial statements46. Co
- Page 257 and 258:
Notes on financial statements46. Co
- Page 259:
Notes on financial statements46. Co
- Page 262 and 263:
Supplementary information on oil an
- Page 264 and 265:
Supplementary information on oil an
- Page 266 and 267:
Supplementary information on oil an
- Page 268 and 269:
Supplementary information on oil an
- Page 270 and 271:
Supplementary information on oil an
- Page 272 and 273:
Supplementary information on oil an
- Page 274 and 275:
Supplementary information on oil an
- Page 276 and 277:
Supplementary information on oil an
- Page 278 and 279:
Supplementary information on oil an
- Page 280 and 281:
Supplementary information on oil an
- Page 282 and 283:
Supplementary information on oil an
- Page 284 and 285:
SignaturesThe registrant hereby cer
- Page 286 and 287:
Parent company financial statements
- Page 288 and 289:
Parent company financial statements
- Page 290 and 291:
Parent company financial statements
- Page 292 and 293:
Parent company financial statements
- Page 294 and 295:
Parent company financial statements
- Page 296 and 297:
Parent company financial statements
- Page 298 and 299:
Parent company financial statements