- Page 2 and 3:
Cover imagePhotograph of DeepseaSta
- Page 4 and 5:
Cross reference to Form 20-FPageIte
- Page 6 and 7:
Miscellaneous termsIn this document
- Page 8 and 9:
6 BP Annual Report and Form 20-F 20
- Page 10:
Chairman’s letterCarl-Henric Svan
- Page 13 and 14:
During the year, the remuneration c
- Page 15 and 16:
Business review: Group overviewBP A
- Page 17 and 18:
SafetyDuring the year, we reorganiz
- Page 19 and 20:
In Refining and Marketing, our worl
- Page 21 and 22:
Crude oil and gas prices,and refini
- Page 23:
In detailFor more information, seeR
- Page 26 and 27:
Our market: Longer-term outlookThe
- Page 29 and 30:
BP’s distinctive capabilities and
- Page 31 and 32:
Technology will continue to play a
- Page 33 and 34:
In detailFor more information,see C
- Page 35 and 36:
In detailFind out more online.bp.co
- Page 37 and 38:
BP Annual Report and Form 20-F 2011
- Page 39 and 40:
Below BP has asignificant presencei
- Page 41 and 42:
What you can measure6 Active portfo
- Page 43 and 44:
Business review: Group overview2012
- Page 45 and 46:
Our risk management systemOur enhan
- Page 47 and 48:
Our current strategic priorities ar
- Page 49 and 50:
Our performance2011 was a year of f
- Page 51 and 52:
Left BP employeesat work in Prudhoe
- Page 53 and 54:
We continued to sell non-core asset
- Page 55 and 56:
Reported recordableinjury frequency
- Page 57 and 58:
Business reviewBP in more depth56 F
- Page 59 and 60:
Business reviewThe primary addition
- Page 61 and 62:
Business reviewRisk factorsWe urge
- Page 63 and 64:
Business review2010. Similar action
- Page 65 and 66:
Business reviewBusiness continuity
- Page 67:
Business reviewSafetyOver the past
- Page 70:
Business reviewour review of all th
- Page 73 and 74:
Business reviewGreenhouse gas regul
- Page 75 and 76:
Business reviewresources such as dr
- Page 77 and 78:
Business reviewExploration and Prod
- Page 79 and 80:
Business reviewCompleting the respo
- Page 81 and 82:
Business reviewgrants, which were s
- Page 83 and 84:
Business reviewOur performanceKey s
- Page 85 and 86:
Business reviewwere in Russia (Oren
- Page 87 and 88:
Business reviewCanadaIn Canada, BP
- Page 89 and 90:
Business review• In March 2011, T
- Page 91 and 92:
Business reviewaccess advantageous
- Page 93 and 94:
Business reviewBP’s vice presiden
- Page 95 and 96:
Business reviewhttp://www.bp.com/do
- Page 97 and 98:
Business reviewbalance of participa
- Page 99 and 100:
Business reviewAcquisitions and dis
- Page 101 and 102:
Business reviewLPGOur global LPG ma
- Page 103 and 104:
Business reviewOther businesses and
- Page 105 and 106:
Business reviewLiquidity and capita
- Page 107 and 108:
Business reviewThe group expects it
- Page 109 and 110:
Business reviewFrequently, work (in
- Page 111 and 112:
Business reviewHazardous and Noxiou
- Page 113 and 114:
Business reviewpart of a larger por
- Page 115 and 116:
Directors andsenior management114 D
- Page 117 and 118:
Directors and senior managementDire
- Page 119 and 120:
Directors and senior managementH L
- Page 121 and 122:
Corporate governanceCorporate gover
- Page 123 and 124:
Corporate governanceAntony Burgmans
- Page 125 and 126:
Corporate governanceBoard oversight
- Page 127 and 128:
Corporate governanceBoard and commi
- Page 129 and 130:
Corporate governancefinancial repor
- Page 131 and 132:
Corporate governancechairs and secr
- Page 133 and 134:
Corporate governance• Oversee GCR
- Page 135 and 136:
Corporate governanceCommittee’s r
- Page 137 and 138:
Corporate governanceControls and pr
- Page 139 and 140:
Corporate governanceThe Act require
- Page 141 and 142:
Directors’ remuneration reportRem
- Page 143 and 144:
Directors’ remuneration reportSum
- Page 145 and 146:
Directors’ remuneration reportSaf
- Page 147 and 148:
Directors’ remuneration reportRem
- Page 149 and 150:
Directors’ remuneration reportThe
- Page 151 and 152:
Directors’ remuneration reportSha
- Page 153 and 154:
Directors’ remuneration reportNon
- Page 155 and 156:
Additional informationfor sharehold
- Page 157 and 158:
Additional information for sharehol
- Page 159 and 160:
Additional information for sharehol
- Page 161 and 162:
Additional information for sharehol
- Page 163 and 164:
Additional information for sharehol
- Page 165 and 166:
Additional information for sharehol
- Page 167 and 168:
Additional information for sharehol
- Page 169 and 170:
Additional information for sharehol
- Page 171 and 172:
Additional information for sharehol
- Page 173 and 174:
Additional information for sharehol
- Page 175 and 176:
Financial statements174 Statement o
- Page 177 and 178: Consolidated financial statements o
- Page 179 and 180: Consolidated financial statements o
- Page 181 and 182: Consolidated financial statements o
- Page 183 and 184: Consolidated financial statements o
- Page 185 and 186: Notes on financial statements1. Sig
- Page 187 and 188: Notes on financial statements1. Sig
- Page 189 and 190: Notes on financial statements1. Sig
- Page 191 and 192: Notes on financial statements1. Sig
- Page 193 and 194: Notes on financial statementshttp:/
- Page 195 and 196: Notes on financial statementshttp:/
- Page 197 and 198: Notes on financial statements3. Bus
- Page 199 and 200: Notes on financial statements5. Dis
- Page 201 and 202: Notes on financial statements5. Dis
- Page 203 and 204: Notes on financial statementshttp:/
- Page 205 and 206: Notes on financial statementshttp:/
- Page 207 and 208: Notes on financial statements7. Int
- Page 209 and 210: Notes on financial statements10. Im
- Page 211 and 212: Notes on financial statements15. Ex
- Page 213 and 214: Notes on financial statementshttp:/
- Page 215 and 216: Notes on financial statementshttp:/
- Page 217 and 218: Notes on financial statementshttp:/
- Page 219 and 220: Notes on financial statements26. Fi
- Page 221 and 222: Notes on financial statements26. Fi
- Page 223 and 224: Notes on financial statements26. Fi
- Page 225 and 226: Notes on financial statements29. Tr
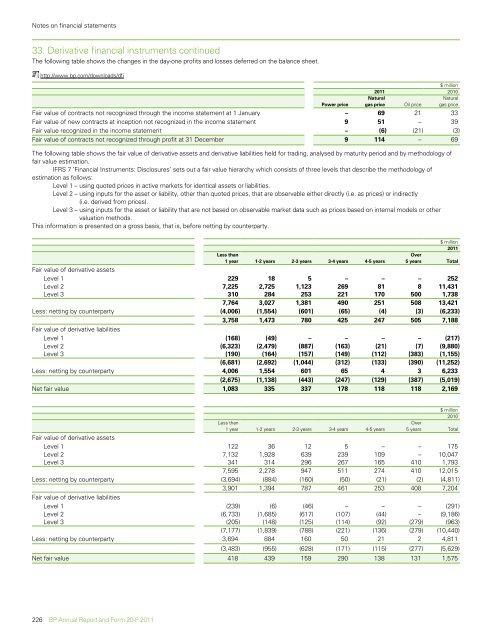
- Page 227: Notes on financial statements33. De
- Page 231 and 232: Notes on financial statements34. Fi
- Page 233 and 234: Notes on financial statementshttp:/
- Page 235 and 236: Notes on financial statements36. Pr
- Page 237 and 238: Notes on financial statements37. Pe
- Page 239 and 240: Notes on financial statements37. Pe
- Page 241 and 242: Notes on financial statements37. Pe
- Page 243 and 244: Notes on financial statements38. Ca
- Page 245 and 246: Notes on financial statementsTotal
- Page 247 and 248: Notes on financial statements39. Ca
- Page 249 and 250: Notes on financial statements40. Sh
- Page 251 and 252: Notes on financial statements42. Re
- Page 253 and 254: Notes on financial statements45. Su
- Page 255 and 256: Notes on financial statements46. Co
- Page 257 and 258: Notes on financial statements46. Co
- Page 259: Notes on financial statements46. Co
- Page 262 and 263: Supplementary information on oil an
- Page 264 and 265: Supplementary information on oil an
- Page 266 and 267: Supplementary information on oil an
- Page 268 and 269: Supplementary information on oil an
- Page 270 and 271: Supplementary information on oil an
- Page 272 and 273: Supplementary information on oil an
- Page 274 and 275: Supplementary information on oil an
- Page 276 and 277: Supplementary information on oil an
- Page 278 and 279:
Supplementary information on oil an
- Page 280 and 281:
Supplementary information on oil an
- Page 282 and 283:
Supplementary information on oil an
- Page 284 and 285:
SignaturesThe registrant hereby cer
- Page 286 and 287:
Parent company financial statements
- Page 288 and 289:
Parent company financial statements
- Page 290 and 291:
Parent company financial statements
- Page 292 and 293:
Parent company financial statements
- Page 294 and 295:
Parent company financial statements
- Page 296 and 297:
Parent company financial statements
- Page 298 and 299:
Parent company financial statements