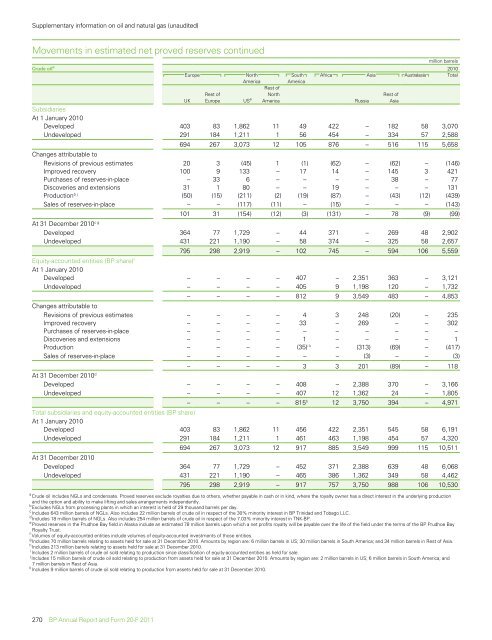
Supplementary information on oil <strong>and</strong> natural gas (unaudited)Movements in estimated net proved reserves continuedmillion barrelsEurope US eCrude oil a <strong>20</strong>10EuropeNorthSouth Africa Asia Australasia TotalAmericaAmericaUKAmericaRussia AsiaRest ofRest ofNorthRest ofSubsidiariesAt 1 January <strong>20</strong>10Developed 403 83 1,862 11 49 422 – 182 58 3,070Undeveloped 291 184 1,211 1 56 454 – 334 57 2,588694 267 3,073 12 105 876 – 516 115 5,658Changes attributable toRevisions of previous estimates <strong>20</strong> 3 (45) 1 (1) (62) – (62) – (146)Improved recovery 100 9 133 – 17 14 – 145 3 421Purchases of reserves-in-place – 33 6 – – – – 38 – 77Discoveries <strong>and</strong> extensions 31 1 80 – – 19 – – – 131Production b j (50) (15) (211) (2) (19) (87) – (43) (12) (439)Sales of reserves-in-place – – (117) (11) – (15) – – – (143)101 31 (154) (12) (3) (131) – 78 (9) (99)At 31 December <strong>20</strong>10 c gDeveloped 364 77 1,729 – 44 371 – 269 48 2,902Undeveloped 431 221 1,190 – 58 374 – 325 58 2,657795 298 2,919 – 102 745 – 594 106 5,559Equity-accounted entities (<strong>BP</strong> share) fAt 1 January <strong>20</strong>10Developed – – – – 407 – 2,351 363 – 3,121Undeveloped – – – – 405 9 1,198 1<strong>20</strong> – 1,732– – – – 812 9 3,549 483 – 4,853Changes attributable toRevisions of previous estimates – – – – 4 3 248 (<strong>20</strong>) – 235Improved recovery – – – – 33 – 269 – – 302Purchases of reserves-in-place – – – – – – – – – –Discoveries <strong>and</strong> extensions – – – – 1 – – – – 1Production – – – – (35) i k – (313) (69) – (417)Sales of reserves-in-place – – – – – – (3) – – (3)– – – – 3 3 <strong>20</strong>1 (89) – 118At 31 December <strong>20</strong>10 dDeveloped – – – – 408 – 2,388 370 – 3,166Undeveloped – – – – 407 12 1,362 24 – 1,805– – – – 815 h 12 3,750 394 – 4,971Total subsidiaries <strong>and</strong> equity-accounted entities (<strong>BP</strong> share)At 1 January <strong>20</strong>10Developed 403 83 1,862 11 456 422 2,351 545 58 6,191Undeveloped 291 184 1,211 1 461 463 1,198 454 57 4,3<strong>20</strong>694 267 3,073 12 917 885 3,549 999 115 10,511At 31 December <strong>20</strong>10Developed 364 77 1,729 – 452 371 2,388 639 48 6,068Undeveloped 431 221 1,190 – 465 386 1,362 349 58 4,462795 298 2,919 – 917 757 3,750 988 106 10,530aCrude oil includes NGLs <strong>and</strong> condensate. Proved reserves exclude royalties due to others, whether payable in cash or in kind, where the royalty owner has a direct interest in the underlying production<strong>and</strong> the option <strong>and</strong> ability to make lifting <strong>and</strong> sales arrangements independently.bExcludes NGLs from processing plants in which an interest is held of 29 thous<strong>and</strong> barrels per day.cIncludes 643 million barrels of NGLs. Also includes 22 million barrels of crude oil in respect of the 30% minority interest in <strong>BP</strong> Trinidad <strong>and</strong> Tobago LLC.dIncludes 18 million barrels of NGLs. Also includes 254 million barrels of crude oil in respect of the 7.03% minority interest in TNK-<strong>BP</strong>.eProved reserves in the Prudhoe Bay field in Alaska include an estimated 78 million barrels upon which a net profits royalty will be payable over the life of the field under the terms of the <strong>BP</strong> Prudhoe BayRoyalty Trust.fVolumes of equity-accounted entities include volumes of equity-accounted investments of those entities.gIncludes 70 million barrels relating to assets held for sale at 31 December <strong>20</strong>10. Amounts by region are: 6 million barrels in US; 30 million barrels in South America; <strong>and</strong> 34 million barrels in Rest of Asia.hIncludes 213 million barrels relating to assets held for sale at 31 December <strong>20</strong>10.iIncludes 2 million barrels of crude oil sold relating to production since classification of equity-accounted entities as held for sale.jIncludes 15 million barrels of crude oil sold relating to production from assets held for sale at 31 December <strong>20</strong>10. Amounts by region are: 2 million barrels in US; 6 million barrels in South America; <strong>and</strong>7 million barrels in Rest of Asia.kIncludes 9 million barrels of crude oil sold relating to production from assets held for sale at 31 December <strong>20</strong>10.270 <strong>BP</strong> <strong>Annual</strong> <strong>Report</strong> <strong>and</strong> <strong>Form</strong> <strong>20</strong>-F <strong>20</strong>11
Supplementary information on oil <strong>and</strong> natural gas (unaudited)Movements in estimated net proved reserves continuedbillion cubic feetNatural gas a <strong>20</strong>10EuropeNorthAmericaSouthAmericaAfrica Asia Australasia TotalUKRest ofEuropeUSSubsidiariesAt 1 January <strong>20</strong>10Developed 1,602 49 9,583 716 3,177 1,107 – 1,579 3,219 21,032Undeveloped 670 397 5,633 453 7,393 1,454 – 249 3,107 19,3562,272 446 15,216 1,169 10,570 2,561 – 1,828 6,326 40,388Changes attributable toRevisions of previous estimates (8) (5) (1,854) (11) 2 3 – (142) (191) (2,<strong>20</strong>6)Improved recovery 152 6 830 – 512 18 – 83 58 1,659Purchases of reserves-in-place – 31 97 1 – – – 17 – 146Discoveries <strong>and</strong> extensions 26 – 739 9 19 1,378 – – – 2,171Production b i (191) (8) (861) (77) (953) (229) – (228) (288) (2,835)Sales of reserves-in-place (6) – (424) (1,033) – (51) – – – (1,514)(27) 24 (1,473) (1,111) (4<strong>20</strong>) 1,119 – (270) (421) (2,579)At 31 December <strong>20</strong>10 c fDeveloped 1,416 40 9,495 58 3,575 1,329 – 1,290 3,563 <strong>20</strong>,766Undeveloped 829 430 4,248 – 6,575 2,351 – 268 2,342 17,0432,245 470 13,743 58 10,150 3,680 – 1,558 5,905 37,809Equity-accounted entities (<strong>BP</strong> share) eAt 1 January <strong>20</strong>10Developed – – – – 1,252 – 1,703 80 – 3,035Undeveloped – – – – 1,010 165 519 13 – 1,707– – – – 2,262 165 2,222 93 – 4,742Changes attributable toRevisions of previous estimates – – – – (141) 10 382 2 – 253Improved recovery – – – – 291 – – 12 – 303Purchases of reserves-in-place – – – – – – – – – –Discoveries <strong>and</strong> extensions – – – – 23 – – – – 23Production b – – – – (168) h j – (244) (17) – (429)Sales of reserves-in-place – – – – – – (1) – – (1)– – – – 5 10 137 (3) – 149At 31 December <strong>20</strong>10 dDeveloped – – – – 1,075 – 1,900 71 – 3,046Undeveloped – – – – 1,192 175 459 19 – 1,845– – – – 2,267 g 175 2,359 90 – 4,891Total subsidiaries <strong>and</strong> equity-accounted entities (<strong>BP</strong> share)At 1 January <strong>20</strong>10Developed 1,602 49 9,583 716 4,429 1,107 1,703 1,659 3,219 24,067Undeveloped 670 397 5,633 453 8,403 1,619 519 262 3,107 21,0632,272 446 15,216 1,169 12,832 2,726 2,222 1,921 6,326 45,130At 31 December <strong>20</strong>10Developed 1,416 40 9,495 58 4,650 1,329 1,900 1,361 3,563 23,812Undeveloped 829 430 4,248 – 7,767 2,526 459 287 2,342 18,8882,245 470 13,743 58 12,417 3,855 2,359 1,648 5,905 42,700aProved reserves exclude royalties due to others, whether payable in cash or in kind, where the royalty owner has a direct interest in the underlying production <strong>and</strong> the option <strong>and</strong> ability to make lifting <strong>and</strong>sales arrangements independently.bIncludes <strong>20</strong>4 billion cubic feet of natural gas consumed in operations, 166 billion cubic feet in subsidiaries, 38 billion cubic feet in equity-accounted entities <strong>and</strong> excludes 14 billion cubic feet of producednon-hydrocarbon components which meet regulatory requirements for sales.cRest ofNorthAmericaIncludes 2,921 billion cubic feet of natural gas in respect of the 30% minority interest in <strong>BP</strong> Trinidad <strong>and</strong> Tobago LLC.dIncludes 137 billion cubic feet of natural gas in respect of the 5.89% minority interest in TNK-<strong>BP</strong>.eVolumes of equity-accounted entities include volumes of equity-accounted investments of those entities.fIncludes 740 billion cubic feet relating to assets held for sale at 31 December <strong>20</strong>10. Amounts by region are: 158 billion cubic feet in US; <strong>20</strong>5 billion cubic feet in South America; <strong>and</strong> 377 billion cubic feet inRest of Asia.gIncludes 50 billion cubic feet relating to assets held for sale at 31 December <strong>20</strong>10.hIncludes 1 billion cubic feet of gas sales relating to production since classification of equity-accounted entities as held for sale.iIncludes 133 billion cubic feet of gas (excluding gas consumed in operations) relating to production from assets held for sale at 31 December <strong>20</strong>10. Amounts by region are: 23 billion cubic feet in US;27 billion cubic feet in South America; <strong>and</strong> 83 billion cubic feet in Rest of Asia.jIncludes 3 billion cubic feet of gas (excluding gas consumed in operations) relating to production from assets held for sale at 31 December <strong>20</strong>10.RussiaRest ofAsiaFinancial statements<strong>BP</strong> <strong>Annual</strong> <strong>Report</strong> <strong>and</strong> <strong>Form</strong> <strong>20</strong>-F <strong>20</strong>11 271
- Page 2 and 3:
Cover imagePhotograph of DeepseaSta
- Page 4 and 5:
Cross reference to Form 20-FPageIte
- Page 6 and 7:
Miscellaneous termsIn this document
- Page 8 and 9:
6 BP Annual Report and Form 20-F 20
- Page 10:
Chairman’s letterCarl-Henric Svan
- Page 13 and 14:
During the year, the remuneration c
- Page 15 and 16:
Business review: Group overviewBP A
- Page 17 and 18:
SafetyDuring the year, we reorganiz
- Page 19 and 20:
In Refining and Marketing, our worl
- Page 21 and 22:
Crude oil and gas prices,and refini
- Page 23:
In detailFor more information, seeR
- Page 26 and 27:
Our market: Longer-term outlookThe
- Page 29 and 30:
BP’s distinctive capabilities and
- Page 31 and 32:
Technology will continue to play a
- Page 33 and 34:
In detailFor more information,see C
- Page 35 and 36:
In detailFind out more online.bp.co
- Page 37 and 38:
BP Annual Report and Form 20-F 2011
- Page 39 and 40:
Below BP has asignificant presencei
- Page 41 and 42:
What you can measure6 Active portfo
- Page 43 and 44:
Business review: Group overview2012
- Page 45 and 46:
Our risk management systemOur enhan
- Page 47 and 48:
Our current strategic priorities ar
- Page 49 and 50:
Our performance2011 was a year of f
- Page 51 and 52:
Left BP employeesat work in Prudhoe
- Page 53 and 54:
We continued to sell non-core asset
- Page 55 and 56:
Reported recordableinjury frequency
- Page 57 and 58:
Business reviewBP in more depth56 F
- Page 59 and 60:
Business reviewThe primary addition
- Page 61 and 62:
Business reviewRisk factorsWe urge
- Page 63 and 64:
Business review2010. Similar action
- Page 65 and 66:
Business reviewBusiness continuity
- Page 67:
Business reviewSafetyOver the past
- Page 70:
Business reviewour review of all th
- Page 73 and 74:
Business reviewGreenhouse gas regul
- Page 75 and 76:
Business reviewresources such as dr
- Page 77 and 78:
Business reviewExploration and Prod
- Page 79 and 80:
Business reviewCompleting the respo
- Page 81 and 82:
Business reviewgrants, which were s
- Page 83 and 84:
Business reviewOur performanceKey s
- Page 85 and 86:
Business reviewwere in Russia (Oren
- Page 87 and 88:
Business reviewCanadaIn Canada, BP
- Page 89 and 90:
Business review• In March 2011, T
- Page 91 and 92:
Business reviewaccess advantageous
- Page 93 and 94:
Business reviewBP’s vice presiden
- Page 95 and 96:
Business reviewhttp://www.bp.com/do
- Page 97 and 98:
Business reviewbalance of participa
- Page 99 and 100:
Business reviewAcquisitions and dis
- Page 101 and 102:
Business reviewLPGOur global LPG ma
- Page 103 and 104:
Business reviewOther businesses and
- Page 105 and 106:
Business reviewLiquidity and capita
- Page 107 and 108:
Business reviewThe group expects it
- Page 109 and 110:
Business reviewFrequently, work (in
- Page 111 and 112:
Business reviewHazardous and Noxiou
- Page 113 and 114:
Business reviewpart of a larger por
- Page 115 and 116:
Directors andsenior management114 D
- Page 117 and 118:
Directors and senior managementDire
- Page 119 and 120:
Directors and senior managementH L
- Page 121 and 122:
Corporate governanceCorporate gover
- Page 123 and 124:
Corporate governanceAntony Burgmans
- Page 125 and 126:
Corporate governanceBoard oversight
- Page 127 and 128:
Corporate governanceBoard and commi
- Page 129 and 130:
Corporate governancefinancial repor
- Page 131 and 132:
Corporate governancechairs and secr
- Page 133 and 134:
Corporate governance• Oversee GCR
- Page 135 and 136:
Corporate governanceCommittee’s r
- Page 137 and 138:
Corporate governanceControls and pr
- Page 139 and 140:
Corporate governanceThe Act require
- Page 141 and 142:
Directors’ remuneration reportRem
- Page 143 and 144:
Directors’ remuneration reportSum
- Page 145 and 146:
Directors’ remuneration reportSaf
- Page 147 and 148:
Directors’ remuneration reportRem
- Page 149 and 150:
Directors’ remuneration reportThe
- Page 151 and 152:
Directors’ remuneration reportSha
- Page 153 and 154:
Directors’ remuneration reportNon
- Page 155 and 156:
Additional informationfor sharehold
- Page 157 and 158:
Additional information for sharehol
- Page 159 and 160:
Additional information for sharehol
- Page 161 and 162:
Additional information for sharehol
- Page 163 and 164:
Additional information for sharehol
- Page 165 and 166:
Additional information for sharehol
- Page 167 and 168:
Additional information for sharehol
- Page 169 and 170:
Additional information for sharehol
- Page 171 and 172:
Additional information for sharehol
- Page 173 and 174:
Additional information for sharehol
- Page 175 and 176:
Financial statements174 Statement o
- Page 177 and 178:
Consolidated financial statements o
- Page 179 and 180:
Consolidated financial statements o
- Page 181 and 182:
Consolidated financial statements o
- Page 183 and 184:
Consolidated financial statements o
- Page 185 and 186:
Notes on financial statements1. Sig
- Page 187 and 188:
Notes on financial statements1. Sig
- Page 189 and 190:
Notes on financial statements1. Sig
- Page 191 and 192:
Notes on financial statements1. Sig
- Page 193 and 194:
Notes on financial statementshttp:/
- Page 195 and 196:
Notes on financial statementshttp:/
- Page 197 and 198:
Notes on financial statements3. Bus
- Page 199 and 200:
Notes on financial statements5. Dis
- Page 201 and 202:
Notes on financial statements5. Dis
- Page 203 and 204:
Notes on financial statementshttp:/
- Page 205 and 206:
Notes on financial statementshttp:/
- Page 207 and 208:
Notes on financial statements7. Int
- Page 209 and 210:
Notes on financial statements10. Im
- Page 211 and 212:
Notes on financial statements15. Ex
- Page 213 and 214:
Notes on financial statementshttp:/
- Page 215 and 216:
Notes on financial statementshttp:/
- Page 217 and 218:
Notes on financial statementshttp:/
- Page 219 and 220:
Notes on financial statements26. Fi
- Page 221 and 222: Notes on financial statements26. Fi
- Page 223 and 224: Notes on financial statements26. Fi
- Page 225 and 226: Notes on financial statements29. Tr
- Page 227 and 228: Notes on financial statements33. De
- Page 229 and 230: Notes on financial statements33. De
- Page 231 and 232: Notes on financial statements34. Fi
- Page 233 and 234: Notes on financial statementshttp:/
- Page 235 and 236: Notes on financial statements36. Pr
- Page 237 and 238: Notes on financial statements37. Pe
- Page 239 and 240: Notes on financial statements37. Pe
- Page 241 and 242: Notes on financial statements37. Pe
- Page 243 and 244: Notes on financial statements38. Ca
- Page 245 and 246: Notes on financial statementsTotal
- Page 247 and 248: Notes on financial statements39. Ca
- Page 249 and 250: Notes on financial statements40. Sh
- Page 251 and 252: Notes on financial statements42. Re
- Page 253 and 254: Notes on financial statements45. Su
- Page 255 and 256: Notes on financial statements46. Co
- Page 257 and 258: Notes on financial statements46. Co
- Page 259: Notes on financial statements46. Co
- Page 262 and 263: Supplementary information on oil an
- Page 264 and 265: Supplementary information on oil an
- Page 266 and 267: Supplementary information on oil an
- Page 268 and 269: Supplementary information on oil an
- Page 270 and 271: Supplementary information on oil an
- Page 274 and 275: Supplementary information on oil an
- Page 276 and 277: Supplementary information on oil an
- Page 278 and 279: Supplementary information on oil an
- Page 280 and 281: Supplementary information on oil an
- Page 282 and 283: Supplementary information on oil an
- Page 284 and 285: SignaturesThe registrant hereby cer
- Page 286 and 287: Parent company financial statements
- Page 288 and 289: Parent company financial statements
- Page 290 and 291: Parent company financial statements
- Page 292 and 293: Parent company financial statements
- Page 294 and 295: Parent company financial statements
- Page 296 and 297: Parent company financial statements
- Page 298 and 299: Parent company financial statements