Business reviewExploration <strong>and</strong> ProductionAt the end of <strong>20</strong>10, as part of our response to the Deepwater Horizonoil spill, we announced the decision to reorganize the Exploration <strong>and</strong>Production segment to create three separate divisions: Exploration,Developments <strong>and</strong> Production, integrated through a Strategy <strong>and</strong>Integration organization. This structure was established in March <strong>20</strong>11<strong>and</strong> each of the four parts is led by an executive vice president reportingdirectly to the group chief executive. The new organization is designedto change the way we operate, with a particular focus on managingrisk, delivering common st<strong>and</strong>ards <strong>and</strong> processes <strong>and</strong> building technicalcapability. The new organization has not changed the way we report ouroperating segments under IFRS.The Exploration division is accountable for renewing our resourcebase through access, exploration <strong>and</strong> appraisal. The Developmentsdivision is accountable for the safe <strong>and</strong> compliant execution of wells(drilling <strong>and</strong> completions) <strong>and</strong> major projects <strong>and</strong> comprises the globalwells organization <strong>and</strong> the global projects organization, which wereestablished in <strong>20</strong>11. The Production division is accountable for safe <strong>and</strong>compliant operations, including upstream production assets, midstreamtransportation <strong>and</strong> processing activities, <strong>and</strong> the development of ourresource base. Divisional activities are integrated on a regional basis by aregional president reporting to the Production division. The Strategy <strong>and</strong>Integration organization is accountable for optimization <strong>and</strong> integrationacross the divisions, including the delivery of support from the group’sfinance, procurement <strong>and</strong> supply chain, human resources, technology <strong>and</strong>information technology functions.From 1 January <strong>20</strong>12, the group’s investment in TNK-<strong>BP</strong> willbe reported as a separate operating segment, rather than within theExploration <strong>and</strong> Production segment, reflecting the way in which theinvestment is now managed.The group safety <strong>and</strong> operational risk (S&OR) function maintainsour global safety st<strong>and</strong>ards. S&OR staff are deployed at the operating levelwithin the Exploration <strong>and</strong> Production segment to support the systematic<strong>and</strong> disciplined application of those st<strong>and</strong>ards. This creates an independentreporting line, working alongside line management while having the powerto intervene.Our Exploration <strong>and</strong> Production segment included upstream<strong>and</strong> midstream activities in 30 countries in <strong>20</strong>11, including Angola,Azerbaijan, Brazil, Canada, Egypt, India, Iraq, Norway, Russia, Trinidad &Tobago (Trinidad), the UK, the US <strong>and</strong> other locations within Africa, Asia,Australasia <strong>and</strong> South America, as well as gas marketing <strong>and</strong> tradingactivities, primarily in Canada, Europe <strong>and</strong> the US. Upstream activitiesinvolve oil <strong>and</strong> natural gas exploration, field development <strong>and</strong> production.Our exploration <strong>and</strong> appraisal programme is currently focused on Angola,Australia, Azerbaijan, Brazil, Canada, Egypt, the deepwater Gulf of Mexico,the UK North Sea, Oman <strong>and</strong> onshore US. Major development areasinclude Angola, Australia, Azerbaijan, Canada, Egypt, the deepwater Gulf ofMexico, North Africa, <strong>and</strong> the UK North Sea. During <strong>20</strong>11, production camefrom 24 countries. The principal areas of production are Angola, Argentina,Azerbaijan, Egypt, Russia, Trinidad, the UAE, the UK <strong>and</strong> the US.Midstream activities involve the ownership <strong>and</strong> managementof crude oil <strong>and</strong> natural gas pipelines, processing facilities <strong>and</strong> exportterminals, LNG processing facilities <strong>and</strong> transportation, <strong>and</strong> our NGLextraction businesses in Canada, Indonesia, the US <strong>and</strong> the UK. Our mostsignificant midstream pipeline interests are the Trans-Alaska PipelineSystem in the US; the Forties Pipeline System <strong>and</strong> the Central AreaTransmission System pipeline, both in the UK sector of the North Sea;the South Caucasus Pipeline, which runs from Azerbaijan through Georgiato the Turkish border; <strong>and</strong> the Baku-Tbilisi-Ceyhan pipeline, which runsthrough Azerbaijan, Georgia <strong>and</strong> Turkey. Major LNG activities are located inAustralia, Indonesia <strong>and</strong> Trinidad. <strong>BP</strong> is also investing in the LNG businessin Angola.Additionally, our activities include the marketing <strong>and</strong> trading of natural gas,power <strong>and</strong> natural gas liquids. These activities provide routes into liquidmarkets for <strong>BP</strong>’s produced gas, <strong>and</strong> generate margins <strong>and</strong> fees associatedwith the provision of physical products <strong>and</strong> derivatives to third parties <strong>and</strong>income from asset optimization <strong>and</strong> trading.Our oil <strong>and</strong> natural gas production assets are located onshore <strong>and</strong>offshore <strong>and</strong> include wells, gathering centres, in-field flow lines, processingfacilities, storage facilities, offshore platforms, export systems (e.g. transitlines), pipelines <strong>and</strong> LNG plant facilities.Upstream operations in Abu Dhabi, Argentina, Bolivia, Chile, Russia,Venezuela <strong>and</strong> Vietnam as well as some of our operations in Angola,Canada, Indonesia <strong>and</strong> Trinidad are conducted through equity-accountedentities.Our marketEnergy dem<strong>and</strong>, <strong>and</strong> in particular oil dem<strong>and</strong>, has followed overalleconomic trends in recent years, recovering strongly in <strong>20</strong>10 but facingmore challenging conditions in <strong>20</strong>11.Dated Brent for the year averaged $111.26 per barrel, 40%above <strong>20</strong>10’s average of $79.50 per barrel. In <strong>20</strong>12, we expect oil pricemovements to continue to be driven by the pace of global economicgrowth <strong>and</strong> its resulting implications for oil consumption, <strong>and</strong> by OPECproduction decisions.Natural gas prices diverged globally in <strong>20</strong>11, reflecting differentregional dynamics. The average US Henry Hub First of Month Index fellto $4.04/mmBtu, an 8% decrease from <strong>20</strong>10, while in Europe pricesincreased. Spot gas prices at the UK National Balancing Point increased by33% to an average of $56.33 pence per therm for <strong>20</strong>11.After a record increase in <strong>20</strong>10, global gas consumption growthmoderated in <strong>20</strong>11. In the US, economic momentum supported gas usein the first half of the year <strong>and</strong> a hot summer raised dem<strong>and</strong>. Yet domesticproduction outpaced consumption growth due to further increases in theavailability of shale gas.In <strong>20</strong>12, we expect gas markets to continue to be driven by theeconomy, weather, domestic production, LNG supply <strong>and</strong> reductions innuclear power generation following the Fukushima disaster in Japan inMarch <strong>20</strong>11.Our strategyIn Exploration <strong>and</strong> Production, our highest priority is to ensure safe, reliable<strong>and</strong> compliant operations worldwide. Our strategy is to invest to grow longtermvalue by continuing to build a portfolio of material, enduring positionsin the world’s key hydrocarbon basins with a focus on deepwater, gasvalue chains <strong>and</strong> giant fields. Our strategy is enabled by:• A continued focus on safety <strong>and</strong> managing risk.• Strong relationships built on mutual advantage, deep knowledge of thebasins in which we operate, <strong>and</strong> technology.• Building capability along the value chain in Exploration, Developments<strong>and</strong> Production.• Actively managing our portfolio.We intend to increase investment with a focus on Exploration, a keysource of value creation, <strong>and</strong> evolve the nature of our relationships,particularly with national oil companies.80 <strong>BP</strong> <strong>Annual</strong> <strong>Report</strong> <strong>and</strong> <strong>Form</strong> <strong>20</strong>-F <strong>20</strong>11
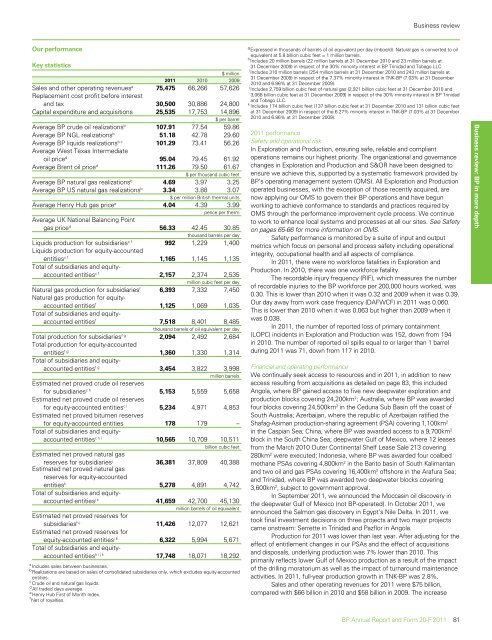
Business reviewOur performanceKey statistics$ million<strong>20</strong>11 <strong>20</strong>10 <strong>20</strong>09Sales <strong>and</strong> other operating revenues a 75,475 66,266 57,626Replacement cost profit before interest<strong>and</strong> tax 30,500 30,886 24,800Capital expenditure <strong>and</strong> acquisitions 25,535 17,753 14,896$ per barrelAverage <strong>BP</strong> crude oil realizations b 107.91 77.54 59.86Average <strong>BP</strong> NGL realizations b 51.18 42.78 29.60Average <strong>BP</strong> liquids realizations b c 101.29 73.41 56.26Average West Texas Intermediateoil price d 95.04 79.45 61.92Average Brent oil price d 111.26 79.50 61.67$ per thous<strong>and</strong> cubic feetAverage <strong>BP</strong> natural gas realizations b 4.69 3.97 3.25Average <strong>BP</strong> US natural gas realizations b 3.34 3.88 3.07$ per million British thermal unitsAverage Henry Hub gas price e 4.04 4.39 3.99pence per thermAverage UK National Balancing Pointgas price d 56.33 42.45 30.85thous<strong>and</strong> barrels per dayLiquids production for subsidiaries c f 992 1,229 1,400Liquids production for equity-accountedentities c f 1,165 1,145 1,135Total of subsidiaries <strong>and</strong> equityaccountedentities c f 2,157 2,374 2,535million cubic feet per dayNatural gas production for subsidiaries f 6,393 7,332 7,450Natural gas production for equityaccountedentities f 1,125 1,069 1,035Total of subsidiaries <strong>and</strong> equityaccountedentities f 7,518 8,401 8,485thous<strong>and</strong> barrels of oil equivalent per dayTotal production for subsidiaries f g 2,094 2,492 2,684Total production for equity-accountedentities f g 1,360 1,330 1,314Total of subsidiaries <strong>and</strong> equityaccountedentities f g 3,454 3,822 3,998million barrelsEstimated net proved crude oil reservesfor subsidiaries c h 5,153 5,559 5,658Estimated net proved crude oil reservesfor equity-accounted entities c i 5,234 4,971 4,853Estimated net proved bitumen reservesfor equity-accounted entities 178 179 –Total of subsidiaries <strong>and</strong> equityaccountedentities c h i 10,565 10,709 10,511billion cubic feetEstimated net proved natural gasreserves for subsidiaries j 36,381 37,809 40,388Estimated net proved natural gasreserves for equity-accountedentities k 5,278 4,891 4,742Total of subsidiaries <strong>and</strong> equityaccountedentities j k 41,659 42,700 45,130million barrels of oil equivalentEstimated net proved reserves forsubsidiaries h j 11,426 12,077 12,621Estimated net proved reserves forequity-accounted entities i k 6,322 5,994 5,671Total of subsidiaries <strong>and</strong> equityaccountedentities h i j k 17,748 18,071 18,292a Includes sales between businesses.b Realizations are based on sales of consolidated subsidiaries only, which excludes equity-accountedentities.c Crude oil <strong>and</strong> natural gas liquids.d All traded days average.e Henry Hub First of Month Index.f Net of royalties.g Expressed in thous<strong>and</strong>s of barrels of oil equivalent per day (mboe/d). Natural gas is converted to oilequivalent at 5.8 billion cubic feet = 1 million barrels.h Includes <strong>20</strong> million barrels (22 million barrels at 31 December <strong>20</strong>10 <strong>and</strong> 23 million barrels at31 December <strong>20</strong>09) in respect of the 30% minority interest in <strong>BP</strong> Trinidad <strong>and</strong> Tobago LLC.i Includes 310 million barrels (254 million barrels at 31 December <strong>20</strong>10 <strong>and</strong> 243 million barrels at31 December <strong>20</strong>09) in respect of the 7.37% minority interest in TNK-<strong>BP</strong> (7.03% at 31 December<strong>20</strong>10 <strong>and</strong> 6.86% at 31 December <strong>20</strong>09).j Includes 2,759 billion cubic feet of natural gas (2,921 billion cubic feet at 31 December <strong>20</strong>10 <strong>and</strong>3,068 billion cubic feet at 31 December <strong>20</strong>09) in respect of the 30% minority interest in <strong>BP</strong> Trinidad<strong>and</strong> Tobago LLC.k Includes 174 billion cubic feet (137 billion cubic feet at 31 December <strong>20</strong>10 <strong>and</strong> 131 billion cubic feetat 31 December <strong>20</strong>09) in respect of the 6.27% minority interest in TNK-<strong>BP</strong> (7.03% at 31 December<strong>20</strong>10 <strong>and</strong> 6.86% at 31 December <strong>20</strong>09).<strong>20</strong>11 performanceSafety <strong>and</strong> operational riskIn Exploration <strong>and</strong> Production, ensuring safe, reliable <strong>and</strong> compliantoperations remains our highest priority. The organizational <strong>and</strong> governancechanges in Exploration <strong>and</strong> Production <strong>and</strong> S&OR have been designed toensure we achieve this, supported by a systematic framework provided by<strong>BP</strong>’s operating management system (OMS). All Exploration <strong>and</strong> Productionoperated businesses, with the exception of those recently acquired, arenow applying our OMS to govern their <strong>BP</strong> operations <strong>and</strong> have begunworking to achieve conformance to st<strong>and</strong>ards <strong>and</strong> practices required byOMS through the performance improvement cycle process. We continueto work to enhance local systems <strong>and</strong> processes at all our sites. See Safetyon pages 65-66 for more information on OMS.Safety performance is monitored by a suite of input <strong>and</strong> outputmetrics which focus on personal <strong>and</strong> process safety including operationalintegrity, occupational health <strong>and</strong> all aspects of compliance.In <strong>20</strong>11, there were no workforce fatalities in Exploration <strong>and</strong>Production. In <strong>20</strong>10, there was one workforce fatality.The recordable injury frequency (RIF), which measures the numberof recordable injuries to the <strong>BP</strong> workforce per <strong>20</strong>0,000 hours worked, was0.30. This is lower than <strong>20</strong>10 when it was 0.32 <strong>and</strong> <strong>20</strong>09 when it was 0.39.Our day away from work case frequency (DAFWCF) in <strong>20</strong>11 was 0.060.This is lower than <strong>20</strong>10 when it was 0.063 but higher than <strong>20</strong>09 when itwas 0.038.In <strong>20</strong>11, the number of reported loss of primary containment(LOPC) incidents in Exploration <strong>and</strong> Production was 152, down from 194in <strong>20</strong>10. The number of reported oil spills equal to or larger than 1 barrelduring <strong>20</strong>11 was 71, down from 117 in <strong>20</strong>10.Financial <strong>and</strong> operating performanceWe continually seek access to resources <strong>and</strong> in <strong>20</strong>11, in addition to newaccess resulting from acquisitions as detailed on page 83, this includedAngola, where <strong>BP</strong> gained access to five new deepwater exploration <strong>and</strong>production blocks covering 24,<strong>20</strong>0km 2 ; Australia, where <strong>BP</strong> was awardedfour blocks covering 24,500km 2 in the Ceduna Sub Basin off the coast ofSouth Australia; Azerbaijan, where the republic of Azerbaijan ratified theShafag-Asiman production-sharing agreement (PSA) covering 1,100km 2in the Caspian Sea; China, where <strong>BP</strong> was awarded access to a 9,700km 2block in the South China Sea; deepwater Gulf of Mexico, where 12 leasesfrom the March <strong>20</strong>10 Outer Continental Shelf Lease Sale 213 covering280km 2 were executed; Indonesia, where <strong>BP</strong> was awarded four coalbedmethane PSAs covering 4,800km 2 in the Barito basin of South Kalimantan<strong>and</strong> two oil <strong>and</strong> gas PSAs covering 16,400km 2 offshore in the Arafura Sea;<strong>and</strong> Trinidad, where <strong>BP</strong> was awarded two deepwater blocks covering3,600km 2 , subject to government approval.In September <strong>20</strong>11, we announced the Moccasin oil discovery inthe deepwater Gulf of Mexico (not <strong>BP</strong>-operated). In October <strong>20</strong>11, weannounced the Salmon gas discovery in Egypt’s Nile Delta. In <strong>20</strong>11, wetook final investment decisions on three projects <strong>and</strong> two major projectscame onstream: Serrette in Trinidad <strong>and</strong> Pazflor in Angola.Production for <strong>20</strong>11 was lower than last year. After adjusting for theeffect of entitlement changes in our PSAs <strong>and</strong> the effect of acquisitions<strong>and</strong> disposals, underlying production was 7% lower than <strong>20</strong>10. Thisprimarily reflects lower Gulf of Mexico production as a result of the impactof the drilling moratorium as well as the impact of turnaround maintenanceactivities. In <strong>20</strong>11, full-year production growth in TNK-<strong>BP</strong> was 2.8%.Sales <strong>and</strong> other operating revenues for <strong>20</strong>11 were $75 billion,compared with $66 billion in <strong>20</strong>10 <strong>and</strong> $58 billion in <strong>20</strong>09. The increaseBusiness review: <strong>BP</strong> in more depth<strong>BP</strong> <strong>Annual</strong> <strong>Report</strong> <strong>and</strong> <strong>Form</strong> <strong>20</strong>-F <strong>20</strong>11 81
- Page 2 and 3:
Cover imagePhotograph of DeepseaSta
- Page 4 and 5:
Cross reference to Form 20-FPageIte
- Page 6 and 7:
Miscellaneous termsIn this document
- Page 8 and 9:
6 BP Annual Report and Form 20-F 20
- Page 10:
Chairman’s letterCarl-Henric Svan
- Page 13 and 14:
During the year, the remuneration c
- Page 15 and 16:
Business review: Group overviewBP A
- Page 17 and 18:
SafetyDuring the year, we reorganiz
- Page 19 and 20:
In Refining and Marketing, our worl
- Page 21 and 22:
Crude oil and gas prices,and refini
- Page 23:
In detailFor more information, seeR
- Page 26 and 27:
Our market: Longer-term outlookThe
- Page 29 and 30:
BP’s distinctive capabilities and
- Page 31 and 32: Technology will continue to play a
- Page 33 and 34: In detailFor more information,see C
- Page 35 and 36: In detailFind out more online.bp.co
- Page 37 and 38: BP Annual Report and Form 20-F 2011
- Page 39 and 40: Below BP has asignificant presencei
- Page 41 and 42: What you can measure6 Active portfo
- Page 43 and 44: Business review: Group overview2012
- Page 45 and 46: Our risk management systemOur enhan
- Page 47 and 48: Our current strategic priorities ar
- Page 49 and 50: Our performance2011 was a year of f
- Page 51 and 52: Left BP employeesat work in Prudhoe
- Page 53 and 54: We continued to sell non-core asset
- Page 55 and 56: Reported recordableinjury frequency
- Page 57 and 58: Business reviewBP in more depth56 F
- Page 59 and 60: Business reviewThe primary addition
- Page 61 and 62: Business reviewRisk factorsWe urge
- Page 63 and 64: Business review2010. Similar action
- Page 65 and 66: Business reviewBusiness continuity
- Page 67: Business reviewSafetyOver the past
- Page 70: Business reviewour review of all th
- Page 73 and 74: Business reviewGreenhouse gas regul
- Page 75 and 76: Business reviewresources such as dr
- Page 77 and 78: Business reviewExploration and Prod
- Page 79 and 80: Business reviewCompleting the respo
- Page 81: Business reviewgrants, which were s
- Page 85 and 86: Business reviewwere in Russia (Oren
- Page 87 and 88: Business reviewCanadaIn Canada, BP
- Page 89 and 90: Business review• In March 2011, T
- Page 91 and 92: Business reviewaccess advantageous
- Page 93 and 94: Business reviewBP’s vice presiden
- Page 95 and 96: Business reviewhttp://www.bp.com/do
- Page 97 and 98: Business reviewbalance of participa
- Page 99 and 100: Business reviewAcquisitions and dis
- Page 101 and 102: Business reviewLPGOur global LPG ma
- Page 103 and 104: Business reviewOther businesses and
- Page 105 and 106: Business reviewLiquidity and capita
- Page 107 and 108: Business reviewThe group expects it
- Page 109 and 110: Business reviewFrequently, work (in
- Page 111 and 112: Business reviewHazardous and Noxiou
- Page 113 and 114: Business reviewpart of a larger por
- Page 115 and 116: Directors andsenior management114 D
- Page 117 and 118: Directors and senior managementDire
- Page 119 and 120: Directors and senior managementH L
- Page 121 and 122: Corporate governanceCorporate gover
- Page 123 and 124: Corporate governanceAntony Burgmans
- Page 125 and 126: Corporate governanceBoard oversight
- Page 127 and 128: Corporate governanceBoard and commi
- Page 129 and 130: Corporate governancefinancial repor
- Page 131 and 132: Corporate governancechairs and secr
- Page 133 and 134:
Corporate governance• Oversee GCR
- Page 135 and 136:
Corporate governanceCommittee’s r
- Page 137 and 138:
Corporate governanceControls and pr
- Page 139 and 140:
Corporate governanceThe Act require
- Page 141 and 142:
Directors’ remuneration reportRem
- Page 143 and 144:
Directors’ remuneration reportSum
- Page 145 and 146:
Directors’ remuneration reportSaf
- Page 147 and 148:
Directors’ remuneration reportRem
- Page 149 and 150:
Directors’ remuneration reportThe
- Page 151 and 152:
Directors’ remuneration reportSha
- Page 153 and 154:
Directors’ remuneration reportNon
- Page 155 and 156:
Additional informationfor sharehold
- Page 157 and 158:
Additional information for sharehol
- Page 159 and 160:
Additional information for sharehol
- Page 161 and 162:
Additional information for sharehol
- Page 163 and 164:
Additional information for sharehol
- Page 165 and 166:
Additional information for sharehol
- Page 167 and 168:
Additional information for sharehol
- Page 169 and 170:
Additional information for sharehol
- Page 171 and 172:
Additional information for sharehol
- Page 173 and 174:
Additional information for sharehol
- Page 175 and 176:
Financial statements174 Statement o
- Page 177 and 178:
Consolidated financial statements o
- Page 179 and 180:
Consolidated financial statements o
- Page 181 and 182:
Consolidated financial statements o
- Page 183 and 184:
Consolidated financial statements o
- Page 185 and 186:
Notes on financial statements1. Sig
- Page 187 and 188:
Notes on financial statements1. Sig
- Page 189 and 190:
Notes on financial statements1. Sig
- Page 191 and 192:
Notes on financial statements1. Sig
- Page 193 and 194:
Notes on financial statementshttp:/
- Page 195 and 196:
Notes on financial statementshttp:/
- Page 197 and 198:
Notes on financial statements3. Bus
- Page 199 and 200:
Notes on financial statements5. Dis
- Page 201 and 202:
Notes on financial statements5. Dis
- Page 203 and 204:
Notes on financial statementshttp:/
- Page 205 and 206:
Notes on financial statementshttp:/
- Page 207 and 208:
Notes on financial statements7. Int
- Page 209 and 210:
Notes on financial statements10. Im
- Page 211 and 212:
Notes on financial statements15. Ex
- Page 213 and 214:
Notes on financial statementshttp:/
- Page 215 and 216:
Notes on financial statementshttp:/
- Page 217 and 218:
Notes on financial statementshttp:/
- Page 219 and 220:
Notes on financial statements26. Fi
- Page 221 and 222:
Notes on financial statements26. Fi
- Page 223 and 224:
Notes on financial statements26. Fi
- Page 225 and 226:
Notes on financial statements29. Tr
- Page 227 and 228:
Notes on financial statements33. De
- Page 229 and 230:
Notes on financial statements33. De
- Page 231 and 232:
Notes on financial statements34. Fi
- Page 233 and 234:
Notes on financial statementshttp:/
- Page 235 and 236:
Notes on financial statements36. Pr
- Page 237 and 238:
Notes on financial statements37. Pe
- Page 239 and 240:
Notes on financial statements37. Pe
- Page 241 and 242:
Notes on financial statements37. Pe
- Page 243 and 244:
Notes on financial statements38. Ca
- Page 245 and 246:
Notes on financial statementsTotal
- Page 247 and 248:
Notes on financial statements39. Ca
- Page 249 and 250:
Notes on financial statements40. Sh
- Page 251 and 252:
Notes on financial statements42. Re
- Page 253 and 254:
Notes on financial statements45. Su
- Page 255 and 256:
Notes on financial statements46. Co
- Page 257 and 258:
Notes on financial statements46. Co
- Page 259:
Notes on financial statements46. Co
- Page 262 and 263:
Supplementary information on oil an
- Page 264 and 265:
Supplementary information on oil an
- Page 266 and 267:
Supplementary information on oil an
- Page 268 and 269:
Supplementary information on oil an
- Page 270 and 271:
Supplementary information on oil an
- Page 272 and 273:
Supplementary information on oil an
- Page 274 and 275:
Supplementary information on oil an
- Page 276 and 277:
Supplementary information on oil an
- Page 278 and 279:
Supplementary information on oil an
- Page 280 and 281:
Supplementary information on oil an
- Page 282 and 283:
Supplementary information on oil an
- Page 284 and 285:
SignaturesThe registrant hereby cer
- Page 286 and 287:
Parent company financial statements
- Page 288 and 289:
Parent company financial statements
- Page 290 and 291:
Parent company financial statements
- Page 292 and 293:
Parent company financial statements
- Page 294 and 295:
Parent company financial statements
- Page 296 and 297:
Parent company financial statements
- Page 298 and 299:
Parent company financial statements