- Page 3 and 4: Chem 155 Unit 1 Page 3 of 3161 Over
- Page 5: Chem 155 Unit 1 Page 5 of 31611.7 L
- Page 8 and 9: Chem 155 Unit 1 Page 8 of 316Tools
- Page 10: Chem 155 Unit 1 Page 10 of 3161.1.3
- Page 14 and 15: Chem 155 Unit 1 Page 14 of 316Vocab
- Page 16: Chem 155 Unit 1 Page 16 of 316When
- Page 21 and 22: Chem 155 Unit 1 Page 21 of 316Use t
- Page 23 and 24: Chem 155 Unit 1 Page 23 of 316C = a
- Page 25 and 26: Chem 155 Unit 1 Page 25 of 316Detec
- Page 27 and 28: Chem 155 Unit 1 Page 27 of 3161.1.1
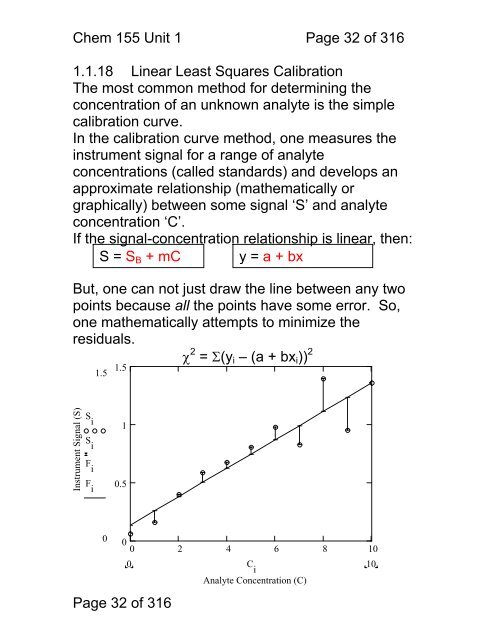
- Page 30 and 31: Chem 155 Unit 1 Page 30 of 3161.1.1
- Page 34 and 35: Chem 155 Unit 1 Page 34 of 316See a
- Page 36 and 37: Chem 155 Unit 1 Page 36 of 3166. Yo
- Page 38 and 39: Chem 155 Unit 1 Page 38 of 3161.1.2
- Page 40 and 41: Chem 155 Unit 1 Page 40 of 3164. Wh
- Page 42 and 43: Chem 155 Unit 1 Page 42 of 3167. Ho
- Page 44 and 45: Chem 155 Unit 1 Page 44 of 316In ge
- Page 46 and 47: Chem 155 Unit 1 Page 46 of 316Reage
- Page 48 and 49: Chem 155 Unit 1 Page 48 of 3161.1.2
- Page 50 and 51: Chem 155 Unit 1 Page 50 of 3161.1.2
- Page 52 and 53: Chem 155 Unit 1 Page 52 of 316Inter
- Page 54 and 55: Chem 155 Unit 1 Page 54 of 3161.1.2
- Page 56 and 57: Chem 155 Unit 2 Page 56 of 316Propa
- Page 58 and 59: Chem 155 Unit 2 Page 58 of 316error
- Page 60 and 61: Chem 155 Unit 2 Page 60 of 316For a
- Page 62 and 63: Chem 155 Unit 2 Page 62 of 316Obvio
- Page 64 and 65: Chem 155 Unit 2 Page 64 of 316The p
- Page 66 and 67: Chem 155 Unit 3 Page 66 of 316Elect
- Page 68 and 69: Chem 155 Unit 3 Page 68 of 316Diffr
- Page 70 and 71: Chem 155 Unit 3 Page 70 of 316Diagr
- Page 72 and 73: Chem 155 Unit 3 Page 72 of 3161.1.3
- Page 74 and 75: Chem 155 Unit 3 Page 74 of 3161.1.3
- Page 76 and 77: Chem 155 Unit 3 Page 76 of 3161.1.3
- Page 78 and 79: Chem 155 Unit 3 Page 78 of 316This
- Page 80 and 81: Chem 155 Unit 3 Page 80 of 3161.1.3
- Page 82 and 83:
Chem 155 Unit 3 Page 82 of 3161.1.3
- Page 84 and 85:
Chem 155 Unit 3 Page 84 of 3161.1.4
- Page 86 and 87:
Chem. 155 Unit 4 Page 86 of 316Phot
- Page 88 and 89:
Chem. 155 Unit 4 Page 88 of 316Bloc
- Page 90 and 91:
Chem. 155 Unit 4 Page 90 of 316Opti
- Page 92 and 93:
Chem. 155 Unit 4 Page 92 of 316Line
- Page 94 and 95:
Chem. 155 Unit 4 Page 94 of 316What
- Page 96 and 97:
Chem. 155 Unit 4 Page 96 of 3161.1.
- Page 98 and 99:
Chem. 155 Unit 4 Page 98 of 3161.1.
- Page 100 and 101:
Chem. 155 Unit 4 Page 100 of 3161.1
- Page 102 and 103:
Chem 155 Unit 5 Page 102 of 316Radi
- Page 104 and 105:
Chem 155 Unit 5 Page 104 of 316What
- Page 106 and 107:
Chem 155 Unit 5 Page 106 of 316Oper
- Page 108 and 109:
Chem 155 Unit 5 Page 108 of 316How
- Page 110 and 111:
Chem 155 Unit 5 Page 110 of 316In s
- Page 112 and 113:
Chem 155 Unit 5 Page 112 of 316Depl
- Page 114 and 115:
Chem 155 Unit 5 Page 114 of 316Char
- Page 116 and 117:
Chem 155 Unit 6 Page 116 of 316Mono
- Page 118 and 119:
Chem 155 Unit 6 Page 118 of 316Mono
- Page 120 and 121:
Chem 155 Unit 6 Page 120 of 316The
- Page 122 and 123:
Chem 155 Unit 6 Page 122 of 316Disp
- Page 124 and 125:
Chem 155 Unit 6 Page 124 of 316For
- Page 126 and 127:
Chem 155 Unit 6 Page 126 of 316Band
- Page 128 and 129:
Chem 155 Unit 6 Page 128 of 316Reso
- Page 130 and 131:
Chem 155 Unit 6 Page 130 of 316Grat
- Page 132 and 133:
Chem 155 Unit 6 Page 132 of 316High
- Page 134 and 135:
Chem 155 Unit 6 Page 134 of 316But
- Page 136 and 137:
Chem 155 Unit 6 Page 136 of 316This
- Page 138 and 139:
Chem 155 Unit 7 Page 138 of 316Page
- Page 140 and 141:
Chem 155 Unit 7 Page 140 of 316Page
- Page 142 and 143:
Chem 155 Unit 7 Page 142 of 316Page
- Page 144 and 145:
Chem 155 Unit 7 Page 144 of 316Page
- Page 146 and 147:
Chem 155 Unit 7 Page 146 of 316Page
- Page 148 and 149:
Chem 155 Unit 7 Page 148 of 316Page
- Page 150 and 151:
Chem 155 Unit 7 Page 150 of 316Thre
- Page 152 and 153:
Chem 155 Unit 8 Page 152 of 316Nebu
- Page 154 and 155:
Chem 155 Unit 8 Page 154 of 316Nebu
- Page 156 and 157:
Chem 155 Unit 8 Page 156 of 316Atom
- Page 158 and 159:
Chem 155 Unit 8 Page 158 of 316Flam
- Page 160 and 161:
Chem 155 Unit 8 Page 160 of 316Flam
- Page 162 and 163:
Chem 155 Unit 9 Atomic Emission Pag
- Page 164 and 165:
Chem 155 Unit 9 Atomic Emission Pag
- Page 166 and 167:
Chem 155 Unit 9 Atomic Emission Pag
- Page 168 and 169:
Chem 155 Unit 9 Atomic Emission Pag
- Page 170 and 171:
Chem 155 Unit 9 Atomic Emission Pag
- Page 172 and 173:
Chem 155 Unit 9 Atomic Emission Pag
- Page 174 and 175:
Chem 155 Unit 9 Atomic Emission Pag
- Page 176 and 177:
Chem 155 Unit 9 Atomic Emission Pag
- Page 178 and 179:
Chem 155 Unit 10 Page 178 of 316The
- Page 180 and 181:
This came out a bit tedious again.C
- Page 182 and 183:
Chem 155 Unit 10 Page 182 of 316Lim
- Page 184 and 185:
Chem 155 Unit 10 Page 184 of 316Lim
- Page 186 and 187:
Chem 155 Unit 10 Page 186 of 316Dev
- Page 188 and 189:
Chem 155 Unit 10 Page 188 of 316Let
- Page 190 and 191:
Chem 155 Unit 10 Page 190 of 316Som
- Page 192 and 193:
Chem 155 Unit 10 Page 192 of 316Sin
- Page 194 and 195:
Chem 155 Unit 10 Page 194 of 316Pho
- Page 196 and 197:
AbsorbanceChem 155 Unit 11 196 of 3
- Page 198 and 199:
Chem 155 Unit 11 198 of 316Spectral
- Page 200 and 201:
Chem 155 Unit 11 200 of 3161.1.59 S
- Page 202 and 203:
Chem 155 Unit 11 202 of 316UV-Visib
- Page 204 and 205:
Chem 155 Unit 11 204 of 316Ligand f
- Page 206 and 207:
Chem 155 Unit 11 206 of 316Lanthani
- Page 208 and 209:
Chem 155 Unit 11 208 of 316Multi-co
- Page 210 and 211:
Chem 155 Unit 11 210 of 316Matrix a
- Page 212 and 213:
Chem 155 Unit 12 212 of 316Overview
- Page 214 and 215:
Chem 155 Unit 12 214 of 316Some exa
- Page 216 and 217:
Chem 155 Unit 12 216 of 316Monochro
- Page 218 and 219:
Chem 155 Unit 12 218 of 316The Mich
- Page 220 and 221:
Chem 155 Unit 12 220 of 316Signal F
- Page 222 and 223:
Chem 155 Unit 12 222 of 316Mono and
- Page 224 and 225:
Chem 155 Unit 12 224 of 316Transfor
- Page 226 and 227:
Chem 155 Unit 12 226 of 316Time vs.
- Page 228 and 229:
Chem 155 Unit 12 228 of 316Resoluti
- Page 230 and 231:
Chem 155 Unit 12 230 of 316For two
- Page 232 and 233:
Chem 155 Unit 12 232 of 316Conclusi
- Page 234 and 235:
Chem 155 Unit 13 Page 234 of 316Inf
- Page 236 and 237:
Chem 155 Unit 13 Page 236 of 316IR
- Page 238 and 239:
Chem 155 Unit 13 Page 238 of 316Rot
- Page 240 and 241:
Chem 155 Unit 13 Page 240 of 316Mod
- Page 242 and 243:
Chem 155 Unit 13 Page 242 of 316Gro
- Page 244 and 245:
Chem 155 Unit 13 Page 244 of 316Gro
- Page 246 and 247:
Chem 155 Unit 13 Page 246 of 316Sum
- Page 248 and 249:
Chem 155 Unit 14 248 of 316Strategi
- Page 250 and 251:
Chem 155 Unit 14 250 of 316Handling
- Page 252 and 253:
Chem 155 Unit 14 252 of 316Group Fr
- Page 254 and 255:
Chem 155 Unit 14 254 of 316Diffuse
- Page 256 and 257:
Chem 155 Unit 14 256 of 316Attenuat
- Page 258 and 259:
Chem 155 Unit 14 258 of 316The refl
- Page 260 and 261:
Chem 155 Unit 15 260 of 316A Raman
- Page 262 and 263:
Chem 155 Unit 15 262 of 316Quantum
- Page 264 and 265:
Chem 155 Unit 15 264 of 316Radiatio
- Page 266 and 267:
Chem 155 Unit 15 266 of 316The clas
- Page 268 and 269:
Chem 155 Unit 15 268 of 316Also not
- Page 270 and 271:
Chem 155 Unit 15 270 of 316Con: Ram
- Page 272 and 273:
Chem 155 Unit 15 272 of 316Raman Ex
- Page 274 and 275:
Chem 155 Unit 15 274 of 31610. Draw
- Page 276 and 277:
Chem 155 Unit 15 276 of 31615. Calc
- Page 278 and 279:
Chem 155 Unit 15 278 of 31617. A pe
- Page 280 and 281:
Chem 155 Unit 16 280 of 316Block di
- Page 282 and 283:
Chem 155 Unit 16 282 of 316Ionizati
- Page 284 and 285:
Chem 155 Unit 16 284 of 3161.1.64 M
- Page 286 and 287:
Chem 155 Unit 16 286 of 316Which is
- Page 288 and 289:
Chem 155 Unit 16 288 of 3161.1.66 M
- Page 290 and 291:
Chem 155 Unit 16 290 of 3161.1.68 Q
- Page 292 and 293:
Chem 155 Unit 16 292 of 316TOF anal
- Page 294 and 295:
Chem 155 Unit 17 Chromatography Pag
- Page 296 and 297:
Chem 155 Unit 17 Chromatography Pag
- Page 298 and 299:
Chem 155 Unit 17 Chromatography Pag
- Page 300 and 301:
Chem 155 Unit 17 Chromatography Pag
- Page 302 and 303:
Chem 155 Unit 17 Chromatography Pag
- Page 304 and 305:
Chem 155 Unit 17 Chromatography Pag
- Page 306 and 307:
Chem 155 Unit 17 Chromatography Pag
- Page 308 and 309:
Chem 155 Unit 17 Chromatography Pag
- Page 310 and 311:
Chem 155 Unit 17 Chromatography Pag