ANNUAL REPORT 2008 - Polymer Bank Notes of the World
ANNUAL REPORT 2008 - Polymer Bank Notes of the World
ANNUAL REPORT 2008 - Polymer Bank Notes of the World

Create successful ePaper yourself
Turn your PDF publications into a flip-book with our unique Google optimized e-Paper software.
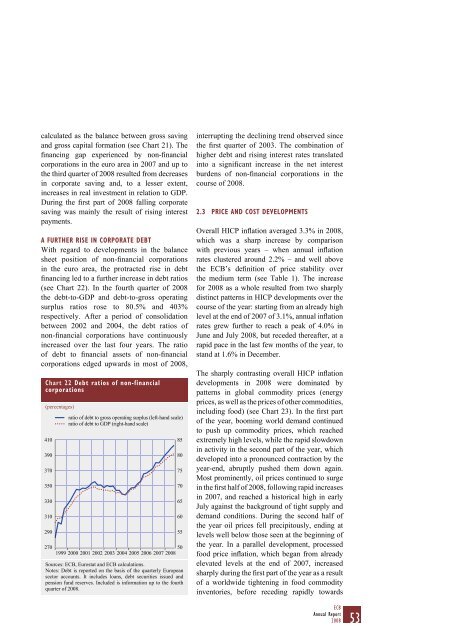
calculated as <strong>the</strong> balance between gross savingand gross capital formation (see Chart 21). Thefinancing gap experienced by non-financialcorporations in <strong>the</strong> euro area in 2007 and up to<strong>the</strong> third quarter <strong>of</strong> <strong>2008</strong> resulted from decreasesin corporate saving and, to a lesser extent,increases in real investment in relation to GDP.During <strong>the</strong> first part <strong>of</strong> <strong>2008</strong> falling corporatesaving was mainly <strong>the</strong> result <strong>of</strong> rising interestpayments.A FURTHER RISE IN CORPORATE DEBTWith regard to developments in <strong>the</strong> balancesheet position <strong>of</strong> non-financial corporationsin <strong>the</strong> euro area, <strong>the</strong> protracted rise in debtfinancing led to a fur<strong>the</strong>r increase in debt ratios(see Chart 22). In <strong>the</strong> fourth quarter <strong>of</strong> <strong>2008</strong><strong>the</strong> debt-to-GDP and debt-to-gross operatingsurplus ratios rose to 80.5% and 403%respectively. After a period <strong>of</strong> consolidationbetween 2002 and 2004, <strong>the</strong> debt ratios <strong>of</strong>non-financial corporations have continuouslyincreased over <strong>the</strong> last four years. The ratio<strong>of</strong> debt to financial assets <strong>of</strong> non-financialcorporations edged upwards in most <strong>of</strong> <strong>2008</strong>,Chart 22 Debt ratios <strong>of</strong> non-financialcorporations(percentages)410390370350330310290ratio <strong>of</strong> debt to gross operating surplus (left-hand scale)ratio <strong>of</strong> debt to GDP (right-hand scale)270501999 2000 2001 2002 2003 2004 2005 2006 2007 <strong>2008</strong>Sources: ECB, Eurostat and ECB calculations.<strong>Notes</strong>: Debt is reported on <strong>the</strong> basis <strong>of</strong> <strong>the</strong> quarterly Europeansector accounts. It includes loans, debt securities issued andpension fund reserves. Included is information up to <strong>the</strong> fourthquarter <strong>of</strong> <strong>2008</strong>.85807570656055interrupting <strong>the</strong> declining trend observed since<strong>the</strong> first quarter <strong>of</strong> 2003. The combination <strong>of</strong>higher debt and rising interest rates translatedinto a significant increase in <strong>the</strong> net interestburdens <strong>of</strong> non-financial corporations in <strong>the</strong>course <strong>of</strong> <strong>2008</strong>.2.3 PRICE AND COST DEVELOPMENTSOverall HICP inflation averaged 3.3% in <strong>2008</strong>,which was a sharp increase by comparisonwith previous years – when annual inflationrates clustered around 2.2% – and well above<strong>the</strong> ECB’s definition <strong>of</strong> price stability over<strong>the</strong> medium term (see Table 1). The increasefor <strong>2008</strong> as a whole resulted from two sharplydistinct patterns in HICP developments over <strong>the</strong>course <strong>of</strong> <strong>the</strong> year: starting from an already highlevel at <strong>the</strong> end <strong>of</strong> 2007 <strong>of</strong> 3.1%, annual inflationrates grew fur<strong>the</strong>r to reach a peak <strong>of</strong> 4.0% inJune and July <strong>2008</strong>, but receded <strong>the</strong>reafter, at arapid pace in <strong>the</strong> last few months <strong>of</strong> <strong>the</strong> year, tostand at 1.6% in December.The sharply contrasting overall HICP inflationdevelopments in <strong>2008</strong> were dominated bypatterns in global commodity prices (energyprices, as well as <strong>the</strong> prices <strong>of</strong> o<strong>the</strong>r commodities,including food) (see Chart 23). In <strong>the</strong> first part<strong>of</strong> <strong>the</strong> year, booming world demand continuedto push up commodity prices, which reachedextremely high levels, while <strong>the</strong> rapid slowdownin activity in <strong>the</strong> second part <strong>of</strong> <strong>the</strong> year, whichdeveloped into a pronounced contraction by <strong>the</strong>year-end, abruptly pushed <strong>the</strong>m down again.Most prominently, oil prices continued to surgein <strong>the</strong> first half <strong>of</strong> <strong>2008</strong>, following rapid increasesin 2007, and reached a historical high in earlyJuly against <strong>the</strong> background <strong>of</strong> tight supply anddemand conditions. During <strong>the</strong> second half <strong>of</strong><strong>the</strong> year oil prices fell precipitously, ending atlevels well below those seen at <strong>the</strong> beginning <strong>of</strong><strong>the</strong> year. In a parallel development, processedfood price inflation, which began from alreadyelevated levels at <strong>the</strong> end <strong>of</strong> 2007, increasedsharply during <strong>the</strong> first part <strong>of</strong> <strong>the</strong> year as a result<strong>of</strong> a worldwide tightening in food commodityinventories, before receding rapidly towardsECBAnnual Report<strong>2008</strong>53
![KNOW YOUR NEW GIBRALTAR BANKNOTES - [Home] bThe/b](https://img.yumpu.com/50890985/1/184x260/know-your-new-gibraltar-banknotes-home-bthe-b.jpg?quality=85)
![PAPUA NEW GUINEA - [Home] - Polymer Bank Notes of the World](https://img.yumpu.com/49758743/1/190x143/papua-new-guinea-home-polymer-bank-notes-of-the-world.jpg?quality=85)