ANNUAL REPORT 2008 - Polymer Bank Notes of the World
ANNUAL REPORT 2008 - Polymer Bank Notes of the World
ANNUAL REPORT 2008 - Polymer Bank Notes of the World

You also want an ePaper? Increase the reach of your titles
YUMPU automatically turns print PDFs into web optimized ePapers that Google loves.
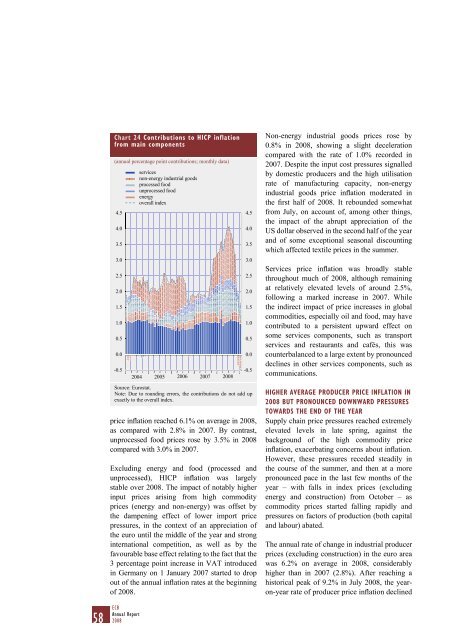
Chart 24 Contributions to HICP inflationfrom main components(annual percentage point contributions; monthly data)4.54.03.53.02.52.01.51.00.50.0-0.5servicesnon-energy industrial goodsprocessed foodunprocessed foodenergyoverall index2004 2005 2006 2007<strong>2008</strong>-0.5Source: Eurostat.Note: Due to rounding errors, <strong>the</strong> contributions do not add upexactly to <strong>the</strong> overall index.price inflation reached 6.1% on average in <strong>2008</strong>,as compared with 2.8% in 2007. By contrast,unprocessed food prices rose by 3.5% in <strong>2008</strong>compared with 3.0% in 2007.Excluding energy and food (processed andunprocessed), HICP inflation was largelystable over <strong>2008</strong>. The impact <strong>of</strong> notably higherinput prices arising from high commodityprices (energy and non-energy) was <strong>of</strong>fset by<strong>the</strong> dampening effect <strong>of</strong> lower import pricepressures, in <strong>the</strong> context <strong>of</strong> an appreciation <strong>of</strong><strong>the</strong> euro until <strong>the</strong> middle <strong>of</strong> <strong>the</strong> year and stronginternational competition, as well as by <strong>the</strong>favourable base effect relating to <strong>the</strong> fact that <strong>the</strong>3 percentage point increase in VAT introducedin Germany on 1 January 2007 started to dropout <strong>of</strong> <strong>the</strong> annual inflation rates at <strong>the</strong> beginning<strong>of</strong> <strong>2008</strong>.4.54.03.53.02.52.01.51.00.50.0Non-energy industrial goods prices rose by0.8% in <strong>2008</strong>, showing a slight decelerationcompared with <strong>the</strong> rate <strong>of</strong> 1.0% recorded in2007. Despite <strong>the</strong> input cost pressures signalledby domestic producers and <strong>the</strong> high utilisationrate <strong>of</strong> manufacturing capacity, non-energyindustrial goods price inflation moderated in<strong>the</strong> first half <strong>of</strong> <strong>2008</strong>. It rebounded somewhatfrom July, on account <strong>of</strong>, among o<strong>the</strong>r things,<strong>the</strong> impact <strong>of</strong> <strong>the</strong> abrupt appreciation <strong>of</strong> <strong>the</strong>US dollar observed in <strong>the</strong> second half <strong>of</strong> <strong>the</strong> yearand <strong>of</strong> some exceptional seasonal discountingwhich affected textile prices in <strong>the</strong> summer.Services price inflation was broadly stablethroughout much <strong>of</strong> <strong>2008</strong>, although remainingat relatively elevated levels <strong>of</strong> around 2.5%,following a marked increase in 2007. While<strong>the</strong> indirect impact <strong>of</strong> price increases in globalcommodities, especially oil and food, may havecontributed to a persistent upward effect onsome services components, such as transportservices and restaurants and cafés, this wascounterbalanced to a large extent by pronounceddeclines in o<strong>the</strong>r services components, such ascommunications.HIGHER AVERAGE PRODUCER PRICE INFLATION IN<strong>2008</strong> BUT PRONOUNCED DOWNWARD PRESSURESTOWARDS THE END OF THE YEARSupply chain price pressures reached extremelyelevated levels in late spring, against <strong>the</strong>background <strong>of</strong> <strong>the</strong> high commodity priceinflation, exacerbating concerns about inflation.However, <strong>the</strong>se pressures receded steadily in<strong>the</strong> course <strong>of</strong> <strong>the</strong> summer, and <strong>the</strong>n at a morepronounced pace in <strong>the</strong> last few months <strong>of</strong> <strong>the</strong>year – with falls in index prices (excludingenergy and construction) from October – ascommodity prices started falling rapidly andpressures on factors <strong>of</strong> production (both capitaland labour) abated.The annual rate <strong>of</strong> change in industrial producerprices (excluding construction) in <strong>the</strong> euro areawas 6.2% on average in <strong>2008</strong>, considerablyhigher than in 2007 (2.8%). After reaching ahistorical peak <strong>of</strong> 9.2% in July <strong>2008</strong>, <strong>the</strong> yearon-yearrate <strong>of</strong> producer price inflation declined58 ECBAnnual Report<strong>2008</strong>

![KNOW YOUR NEW GIBRALTAR BANKNOTES - [Home] bThe/b](https://img.yumpu.com/50890985/1/184x260/know-your-new-gibraltar-banknotes-home-bthe-b.jpg?quality=85)
![PAPUA NEW GUINEA - [Home] - Polymer Bank Notes of the World](https://img.yumpu.com/49758743/1/190x143/papua-new-guinea-home-polymer-bank-notes-of-the-world.jpg?quality=85)