- Page 1 and 2:
EN2008EUROPEAN CENTRAL BANK ANNUAL
- Page 3 and 4:
© European Central Bank, 2009Addre
- Page 5 and 6:
CHAPTER 4FINANCIAL STABILITY AND IN
- Page 7 and 8:
7 Statistical accounting consequenc
- Page 9:
ABBREVIATIONSCOUNTRIESOTHERSBE Belg
- Page 12 and 13:
in the course of the year, in line
- Page 14 and 15:
currencies, T2S will be a major ste
- Page 16 and 17:
CHAPTER 1ECONOMICDEVELOPMENTS ANDMO
- Page 18 and 19:
Chart 1 ECB interest rates and mone
- Page 20 and 21: Despite moderating, the annual grow
- Page 22 and 23: substantial downward revisions in r
- Page 24 and 25: in July, annual inflation in the OE
- Page 26 and 27: As regards the Chinese economy, rea
- Page 28 and 29: generally tighter financing conditi
- Page 30 and 31: were recorded in December, but thes
- Page 32 and 33: was driven mainly by developments i
- Page 34 and 35: market tensions, particularly for l
- Page 36 and 37: anking and financial system. At the
- Page 38 and 39: cash flows to compensate for a redu
- Page 40 and 41: quarter of 2008 and -0.1% in Decemb
- Page 42 and 43: whereby investors’ uncertainty su
- Page 44 and 45: September onwards, amid the great u
- Page 46 and 47: Chart C Trading volumes for governm
- Page 48 and 49: sponsored rescue plans were initiat
- Page 50 and 51: The annual growth rate of consumer
- Page 52 and 53: end of 2007. By December 2008 this
- Page 54 and 55: calculated as the balance between g
- Page 56 and 57: commodity prices (see Box 4). Conve
- Page 58 and 59: Chart D Longer-term inflation expec
- Page 60 and 61: apidly to 1.7% in December, mainly
- Page 62 and 63: productivity slowed to 0.2% in the
- Page 64 and 65: Table 3 Composition of real GDP gro
- Page 66 and 67: Corporate investment, which had exp
- Page 68 and 69: Box 5LABOUR MARKET DEVELOPMENTS IN
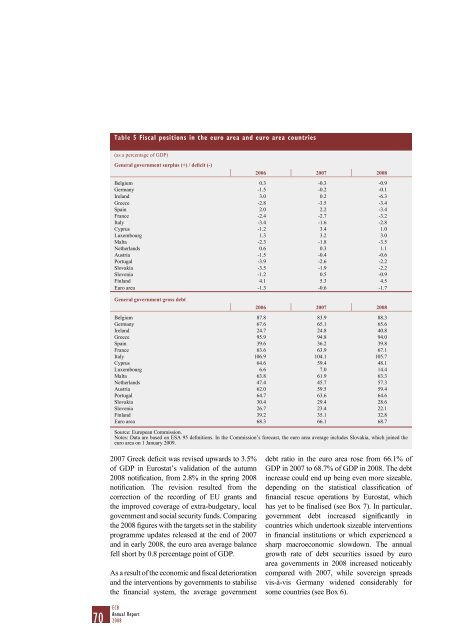
- Page 72 and 73: Box 6DEVELOPMENTS IN THE ISSUANCE A
- Page 74 and 75: Chart B Government bond yield sprea
- Page 76 and 77: Box 7STATISTICAL ACCOUNTING CONSEQU
- Page 78 and 79: warranted because of the need to co
- Page 80 and 81: sharp depreciation of the euro was
- Page 82 and 83: prices in the first eight months of
- Page 84 and 85: focused more on the production rath
- Page 86 and 87: segments and, in turn, affected eur
- Page 88 and 89: and Bulgaria registered robust grow
- Page 90 and 91: In the remaining non-euro area EU c
- Page 92 and 93: Estonian kroon and the Lithuanian l
- Page 94 and 95: Table 10 Official monetary policy s
- Page 96 and 97: the Bank of England and Sveriges Ri
- Page 98 and 99: CHAPTER 2CENTRAL BANKOPERATIONSAND
- Page 100 and 101: Box 10MONETARY POLICY OPERATIONS DU
- Page 102 and 103: Chart A Liquidity supply through op
- Page 104 and 105: franc funding needs of banks with n
- Page 106 and 107: MINIMUM RESERVE SYSTEMCredit instit
- Page 108 and 109: with the ample allotments in the fi
- Page 110 and 111: 2008. By contrast, the average shar
- Page 112 and 113: and SDR holdings increased by aroun
- Page 114 and 115: and the ECB). As a result of carefu
- Page 116 and 117: cross-CSD settlement. T2S will thus
- Page 118 and 119: ELIGIBLE LINKS BETWEEN NATIONAL SEC
- Page 120 and 121:
Chart 48 Number of euro banknotes i
- Page 122 and 123:
3.3 BANKNOTE PRODUCTION AND ISSUANC
- Page 124 and 125:
4 STATISTICSThe ECB, assisted by th
- Page 126 and 127:
iii) payments statistics and iv) de
- Page 128 and 129:
5 ECONOMIC RESEARCHThe main functio
- Page 130 and 131:
were organised to disseminate resea
- Page 132 and 133:
the Financial Collateral Directive,
- Page 134 and 135:
on the Banque centrale du Luxembour
- Page 136 and 137:
standards by individual Eurosystem
- Page 138 and 139:
CHAPTER 3ENTRY OF SLOVAKIAINTO THE
- Page 140 and 141:
Table 13 Main economic indicators f
- Page 142 and 143:
As of January 2009 Slovakia is thus
- Page 144 and 145:
3 OPERATIONAL ASPECTS OF THE INTEGR
- Page 146 and 147:
4 THE CASH CHANGEOVER IN SLOVAKIATH
- Page 149 and 150:
Willem F. Duisenberg accepting the
- Page 151 and 152:
1 FINANCIAL STABILITYThe Eurosystem
- Page 153 and 154:
With regard to merger and acquisiti
- Page 155 and 156:
with the principles set out in Octo
- Page 157 and 158:
2.2 BANKINGCAPITAL REQUIREMENTS DIR
- Page 159 and 160:
3 FINANCIAL INTEGRATIONThe Eurosyst
- Page 161 and 162:
The market for short-term paper in
- Page 163 and 164:
de France and the Banca d’Italia.
- Page 165 and 166:
and the Eurosystem’s business con
- Page 167 and 168:
4.2 RETAIL PAYMENT SYSTEMS ANDINSTR
- Page 169 and 170:
for Clearing and Settlement, and th
- Page 171 and 172:
Willem F. Duisenberg at his farewel
- Page 173 and 174:
1 EUROPEAN ISSUESIn 2008 the ECB co
- Page 175 and 176:
for financial institutions, to faci
- Page 177 and 178:
1.3 DEVELOPMENTS IN AND RELATIONS W
- Page 179 and 180:
On a number of occasions in 2008, t
- Page 181 and 182:
countries have voiced support for t
- Page 183 and 184:
Former Italian President Carlo Azeg
- Page 185 and 186:
1 ACCOUNTABILITY VIS-À-VIS THE GEN
- Page 187:
implementation of the steps foresee
- Page 190 and 191:
CHAPTER 7EXTERNALCOMMUNICATION
- Page 192 and 193:
2 COMMUNICATION ACTIVITIESThe ECB a
- Page 195 and 196:
Panel at the Fifth ECB Central Bank
- Page 197 and 198:
1 DECISION-MAKING BODIES AND CORPOR
- Page 199 and 200:
Council decided on the main aspects
- Page 201 and 202:
1.3 THE EXECUTIVE BOARDThe Executiv
- Page 203 and 204:
1.4 THE GENERAL COUNCILThe General
- Page 205 and 206:
The Eurosystem/ESCB committees have
- Page 207 and 208:
members of the Executive Board. 13
- Page 209 and 210:
for their current position. On the
- Page 211 and 212:
statistical office (Statistisches B
- Page 213 and 214:
4 ANNUAL ACCOUNTS OF THE ECB212 ECB
- Page 215 and 216:
function, and by the Governing Coun
- Page 217 and 218:
BALANCE SHEET AS AT 31 DECEMBER 200
- Page 219 and 220:
PROFIT AND LOSS ACCOUNT FOR THE YEA
- Page 221 and 222:
mid-market prices on 30 December 20
- Page 223 and 224:
The defined benefit obligation is c
- Page 225 and 226:
NOTES ON THE BALANCE SHEET1 GOLD AN
- Page 227 and 228:
Eurosystem (see “Banknotes in cir
- Page 229 and 230:
(see “Banknotes in circulation”
- Page 231 and 232:
values at which the transactions we
- Page 233 and 234:
15 CAPITAL AND RESERVESCAPITALPursu
- Page 235 and 236:
epresenting the remainder of its ca
- Page 237 and 238:
NOTES ON THE PROFIT AND LOSS ACCOUN
- Page 239:
individual circumstances. Basic sal
- Page 243 and 244:
5 CONSOLIDATED BALANCE SHEET OF THE
- Page 246 and 247:
ANNEXES
- Page 248 and 249:
Number Title OJ referenceECB/2008/1
- Page 250 and 251:
Number Title OJ referenceECB/2009/1
- Page 252 and 253:
Number 2 Originator SubjectCON/2008
- Page 254 and 255:
Number 2 Originator SubjectCON/2008
- Page 256 and 257:
Number 2 Originator SubjectCON/2009
- Page 258 and 259:
Number 4 Originator Subject OJ refe
- Page 260 and 261:
oth the marginal lending facility a
- Page 262 and 263:
OVERVIEW OF THE ECB’S COMMUNICATI
- Page 264 and 265:
y the respective NCBs will also be
- Page 266 and 267:
OPEN MARKET OPERATIONS BY CURRENCYE
- Page 268 and 269:
USD operationsType oftransaction 1)
- Page 270 and 271:
DOCUMENTS PUBLISHED BY THEEUROPEAN
- Page 272 and 273:
95 “Financial stability challenge
- Page 274 and 275:
1012 “Petrodollars and imports of
- Page 276 and 277:
GLOSSARYThis glossary contains sele
- Page 278 and 279:
Economic analysis: one pillar of th
- Page 280 and 281:
Financial stability: condition in w
- Page 282 and 283:
MFIs (monetary financial institutio
- Page 284 and 285:
Reserve base: the sum of the eligib


![KNOW YOUR NEW GIBRALTAR BANKNOTES - [Home] bThe/b](https://img.yumpu.com/50890985/1/184x260/know-your-new-gibraltar-banknotes-home-bthe-b.jpg?quality=85)
![PAPUA NEW GUINEA - [Home] - Polymer Bank Notes of the World](https://img.yumpu.com/49758743/1/190x143/papua-new-guinea-home-polymer-bank-notes-of-the-world.jpg?quality=85)


