ANNUAL REPORT 2008 - Polymer Bank Notes of the World
ANNUAL REPORT 2008 - Polymer Bank Notes of the World
ANNUAL REPORT 2008 - Polymer Bank Notes of the World

Create successful ePaper yourself
Turn your PDF publications into a flip-book with our unique Google optimized e-Paper software.
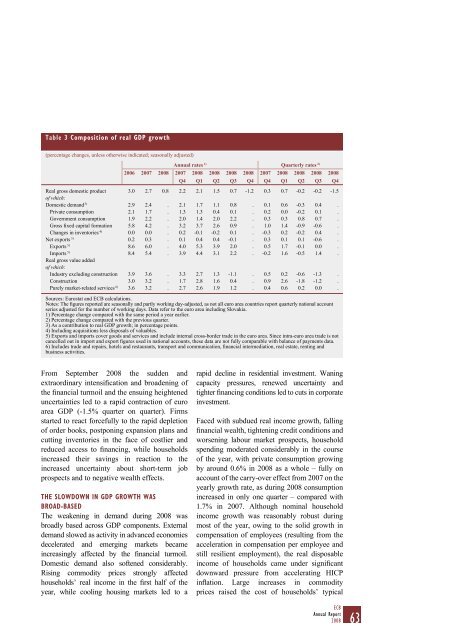
Table 3 Composition <strong>of</strong> real GDP growth(percentage changes, unless o<strong>the</strong>rwise indicated; seasonally adjusted)Annual rates 1) Quarterly rates 2)2006 2007 <strong>2008</strong> 2007 <strong>2008</strong> <strong>2008</strong> <strong>2008</strong> <strong>2008</strong> 2007 <strong>2008</strong> <strong>2008</strong> <strong>2008</strong> <strong>2008</strong>Q4 Q1 Q2 Q3 Q4 Q4 Q1 Q2 Q3 Q4Real gross domestic product 3.0 2.7 0.8 2.2 2.1 1.5 0.7 -1.2 0.3 0.7 -0.2 -0.2 -1.5<strong>of</strong> which:Domestic demand 3) 2.9 2.4 . 2.1 1.7 1.1 0.8 . 0.1 0.6 -0.3 0.4 .Private consumption 2.1 1.7 . 1.3 1.3 0.4 0.1 . 0.2 0.0 -0.2 0.1 .Government consumption 1.9 2.2 . 2.0 1.4 2.0 2.2 . 0.3 0.3 0.8 0.7 .Gross fixed capital formation 5.8 4.2 . 3.2 3.7 2.6 0.9 . 1.0 1.4 -0.9 -0.6 .Changes in inventories 4) 0.0 0.0 . 0.2 -0.1 -0.2 0.1 . -0.3 0.2 -0.2 0.4 .Net exports 3) 0.2 0.3 . 0.1 0.4 0.4 -0.1 . 0.3 0.1 0.1 -0.6 .Exports 5) 8.6 6.0 . 4.0 5.3 3.9 2.0 . 0.5 1.7 -0.1 0.0 .Imports 5) 8.4 5.4 . 3.9 4.4 3.1 2.2 . -0.2 1.6 -0.5 1.4 .Real gross value added<strong>of</strong> which:Industry excluding construction 3.9 3.6 . 3.3 2.7 1.3 -1.1 . 0.5 0.2 -0.6 -1.3 .Construction 3.0 3.2 . 1.7 2.8 1.6 0.4 . 0.9 2.6 -1.8 -1.2 .Purely market-related services 6) 3.6 3.2 . 2.7 2.6 1.9 1.2 . 0.4 0.6 0.2 0.0 .Sources: Eurostat and ECB calculations.<strong>Notes</strong>: The figures reported are seasonally and partly working day-adjusted, as not all euro area countries report quarterly national accountseries adjusted for <strong>the</strong> number <strong>of</strong> working days. Data refer to <strong>the</strong> euro area including Slovakia.1) Percentage change compared with <strong>the</strong> same period a year earlier.2) Percentage change compared with <strong>the</strong> previous quarter.3) As a contribution to real GDP growth; in percentage points.4) Including acquisitions less disposals <strong>of</strong> valuables.5) Exports and imports cover goods and services and include internal cross-border trade in <strong>the</strong> euro area. Since intra-euro area trade is notcancelled out in import and export figures used in national accounts, <strong>the</strong>se data are not fully comparable with balance <strong>of</strong> payments data.6) Includes trade and repairs, hotels and restaurants, transport and communication, financial intermediation, real estate, renting andbusiness activities.From September <strong>2008</strong> <strong>the</strong> sudden andextraordinary intensification and broadening <strong>of</strong><strong>the</strong> financial turmoil and <strong>the</strong> ensuing heighteneduncertainties led to a rapid contraction <strong>of</strong> euroarea GDP (-1.5% quarter on quarter). Firmsstarted to react forcefully to <strong>the</strong> rapid depletion<strong>of</strong> order books, postponing expansion plans andcutting inventories in <strong>the</strong> face <strong>of</strong> costlier andreduced access to financing, while householdsincreased <strong>the</strong>ir savings in reaction to <strong>the</strong>increased uncertainty about short-term jobprospects and to negative wealth effects.THE SLOWDOWN IN GDP GROWTH WASBROAD-BASEDThe weakening in demand during <strong>2008</strong> wasbroadly based across GDP components. Externaldemand slowed as activity in advanced economiesdecelerated and emerging markets becameincreasingly affected by <strong>the</strong> financial turmoil.Domestic demand also s<strong>of</strong>tened considerably.Rising commodity prices strongly affectedhouseholds’ real income in <strong>the</strong> first half <strong>of</strong> <strong>the</strong>year, while cooling housing markets led to arapid decline in residential investment. Waningcapacity pressures, renewed uncertainty andtighter financing conditions led to cuts in corporateinvestment.Faced with subdued real income growth, fallingfinancial wealth, tightening credit conditions andworsening labour market prospects, householdspending moderated considerably in <strong>the</strong> course<strong>of</strong> <strong>the</strong> year, with private consumption growingby around 0.6% in <strong>2008</strong> as a whole – fully onaccount <strong>of</strong> <strong>the</strong> carry-over effect from 2007 on <strong>the</strong>yearly growth rate, as during <strong>2008</strong> consumptionincreased in only one quarter – compared with1.7% in 2007. Although nominal householdincome growth was reasonably robust duringmost <strong>of</strong> <strong>the</strong> year, owing to <strong>the</strong> solid growth incompensation <strong>of</strong> employees (resulting from <strong>the</strong>acceleration in compensation per employee andstill resilient employment), <strong>the</strong> real disposableincome <strong>of</strong> households came under significantdownward pressure from accelerating HICPinflation. Large increases in commodityprices raised <strong>the</strong> cost <strong>of</strong> households’ typicalECBAnnual Report<strong>2008</strong>63

![KNOW YOUR NEW GIBRALTAR BANKNOTES - [Home] bThe/b](https://img.yumpu.com/50890985/1/184x260/know-your-new-gibraltar-banknotes-home-bthe-b.jpg?quality=85)
![PAPUA NEW GUINEA - [Home] - Polymer Bank Notes of the World](https://img.yumpu.com/49758743/1/190x143/papua-new-guinea-home-polymer-bank-notes-of-the-world.jpg?quality=85)