ANNUAL REPORT 2008 - Polymer Bank Notes of the World
ANNUAL REPORT 2008 - Polymer Bank Notes of the World
ANNUAL REPORT 2008 - Polymer Bank Notes of the World
Create successful ePaper yourself
Turn your PDF publications into a flip-book with our unique Google optimized e-Paper software.
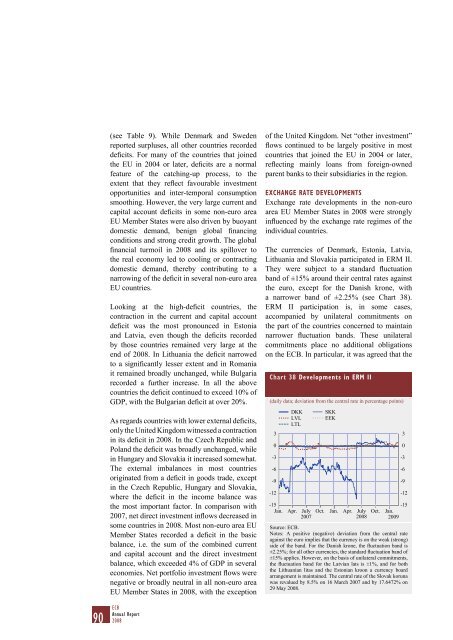
(see Table 9). While Denmark and Swedenreported surpluses, all o<strong>the</strong>r countries recordeddeficits. For many <strong>of</strong> <strong>the</strong> countries that joined<strong>the</strong> EU in 2004 or later, deficits are a normalfeature <strong>of</strong> <strong>the</strong> catching-up process, to <strong>the</strong>extent that <strong>the</strong>y reflect favourable investmentopportunities and inter-temporal consumptionsmoothing. However, <strong>the</strong> very large current andcapital account deficits in some non-euro areaEU Member States were also driven by buoyantdomestic demand, benign global financingconditions and strong credit growth. The globalfinancial turmoil in <strong>2008</strong> and its spillover to<strong>the</strong> real economy led to cooling or contractingdomestic demand, <strong>the</strong>reby contributing to anarrowing <strong>of</strong> <strong>the</strong> deficit in several non-euro areaEU countries.Looking at <strong>the</strong> high-deficit countries, <strong>the</strong>contraction in <strong>the</strong> current and capital accountdeficit was <strong>the</strong> most pronounced in Estoniaand Latvia, even though <strong>the</strong> deficits recordedby those countries remained very large at <strong>the</strong>end <strong>of</strong> <strong>2008</strong>. In Lithuania <strong>the</strong> deficit narrowedto a significantly lesser extent and in Romaniait remained broadly unchanged, while Bulgariarecorded a fur<strong>the</strong>r increase. In all <strong>the</strong> abovecountries <strong>the</strong> deficit continued to exceed 10% <strong>of</strong>GDP, with <strong>the</strong> Bulgarian deficit at over 20%.As regards countries with lower external deficits,only <strong>the</strong> United Kingdom witnessed a contractionin its deficit in <strong>2008</strong>. In <strong>the</strong> Czech Republic andPoland <strong>the</strong> deficit was broadly unchanged, whilein Hungary and Slovakia it increased somewhat.The external imbalances in most countriesoriginated from a deficit in goods trade, exceptin <strong>the</strong> Czech Republic, Hungary and Slovakia,where <strong>the</strong> deficit in <strong>the</strong> income balance was<strong>the</strong> most important factor. In comparison with2007, net direct investment inflows decreased insome countries in <strong>2008</strong>. Most non-euro area EUMember States recorded a deficit in <strong>the</strong> basicbalance, i.e. <strong>the</strong> sum <strong>of</strong> <strong>the</strong> combined currentand capital account and <strong>the</strong> direct investmentbalance, which exceeded 4% <strong>of</strong> GDP in severaleconomies. Net portfolio investment flows werenegative or broadly neutral in all non-euro areaEU Member States in <strong>2008</strong>, with <strong>the</strong> exception<strong>of</strong> <strong>the</strong> United Kingdom. Net “o<strong>the</strong>r investment”flows continued to be largely positive in mostcountries that joined <strong>the</strong> EU in 2004 or later,reflecting mainly loans from foreign-ownedparent banks to <strong>the</strong>ir subsidiaries in <strong>the</strong> region.EXCHANGE RATE DEVELOPMENTSExchange rate developments in <strong>the</strong> non-euroarea EU Member States in <strong>2008</strong> were stronglyinfluenced by <strong>the</strong> exchange rate regimes <strong>of</strong> <strong>the</strong>individual countries.The currencies <strong>of</strong> Denmark, Estonia, Latvia,Lithuania and Slovakia participated in ERM II.They were subject to a standard fluctuationband <strong>of</strong> ±15% around <strong>the</strong>ir central rates against<strong>the</strong> euro, except for <strong>the</strong> Danish krone, witha narrower band <strong>of</strong> ±2.25% (see Chart 38).ERM II participation is, in some cases,accompanied by unilateral commitments on<strong>the</strong> part <strong>of</strong> <strong>the</strong> countries concerned to maintainnarrower fluctuation bands. These unilateralcommitments place no additional obligationson <strong>the</strong> ECB. In particular, it was agreed that <strong>the</strong>Chart 38 Developments in ERM II(daily data; deviation from <strong>the</strong> central rate in percentage points)30-3-6-9-12DKKLVLLTLSKKEEK-15-15Jan. Apr. July Oct. Jan. Apr. July Oct. Jan.2007 <strong>2008</strong> 2009Source: ECB.<strong>Notes</strong>: A positive (negative) deviation from <strong>the</strong> central rateagainst <strong>the</strong> euro implies that <strong>the</strong> currency is on <strong>the</strong> weak (strong)side <strong>of</strong> <strong>the</strong> band. For <strong>the</strong> Danish krone, <strong>the</strong> fluctuation band is±2.25%; for all o<strong>the</strong>r currencies, <strong>the</strong> standard fluctuation band <strong>of</strong>±15% applies. However, on <strong>the</strong> basis <strong>of</strong> unilateral commitments,<strong>the</strong> fluctuation band for <strong>the</strong> Latvian lats is ±1%, and for both<strong>the</strong> Lithuanian litas and <strong>the</strong> Estonian kroon a currency boardarrangement is maintained. The central rate <strong>of</strong> <strong>the</strong> Slovak korunawas revalued by 8.5% on 16 March 2007 and by 17.6472% on29 May <strong>2008</strong>.30-3-6-9-1290 ECBAnnual Report<strong>2008</strong>


![KNOW YOUR NEW GIBRALTAR BANKNOTES - [Home] bThe/b](https://img.yumpu.com/50890985/1/184x260/know-your-new-gibraltar-banknotes-home-bthe-b.jpg?quality=85)
![PAPUA NEW GUINEA - [Home] - Polymer Bank Notes of the World](https://img.yumpu.com/49758743/1/190x143/papua-new-guinea-home-polymer-bank-notes-of-the-world.jpg?quality=85)

