ANNUAL REPORT 2008 - Polymer Bank Notes of the World
ANNUAL REPORT 2008 - Polymer Bank Notes of the World
ANNUAL REPORT 2008 - Polymer Bank Notes of the World

You also want an ePaper? Increase the reach of your titles
YUMPU automatically turns print PDFs into web optimized ePapers that Google loves.
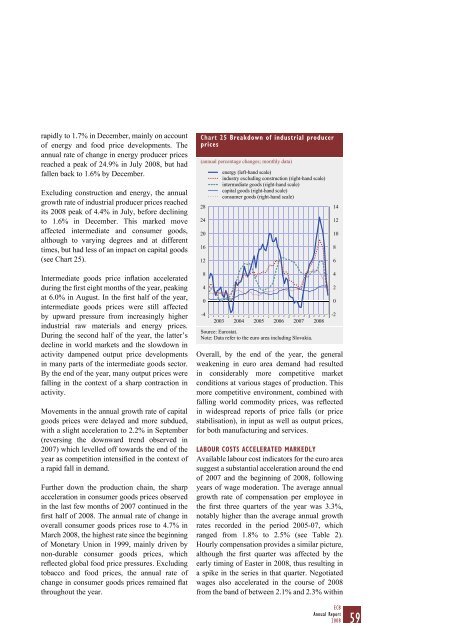
apidly to 1.7% in December, mainly on account<strong>of</strong> energy and food price developments. Theannual rate <strong>of</strong> change in energy producer pricesreached a peak <strong>of</strong> 24.9% in July <strong>2008</strong>, but hadfallen back to 1.6% by December.Excluding construction and energy, <strong>the</strong> annualgrowth rate <strong>of</strong> industrial producer prices reachedits <strong>2008</strong> peak <strong>of</strong> 4.4% in July, before decliningto 1.6% in December. This marked moveaffected intermediate and consumer goods,although to varying degrees and at differenttimes, but had less <strong>of</strong> an impact on capital goods(see Chart 25).Intermediate goods price inflation acceleratedduring <strong>the</strong> first eight months <strong>of</strong> <strong>the</strong> year, peakingat 6.0% in August. In <strong>the</strong> first half <strong>of</strong> <strong>the</strong> year,intermediate goods prices were still affectedby upward pressure from increasingly higherindustrial raw materials and energy prices.During <strong>the</strong> second half <strong>of</strong> <strong>the</strong> year, <strong>the</strong> latter’sdecline in world markets and <strong>the</strong> slowdown inactivity dampened output price developmentsin many parts <strong>of</strong> <strong>the</strong> intermediate goods sector.By <strong>the</strong> end <strong>of</strong> <strong>the</strong> year, many output prices werefalling in <strong>the</strong> context <strong>of</strong> a sharp contraction inactivity.Movements in <strong>the</strong> annual growth rate <strong>of</strong> capitalgoods prices were delayed and more subdued,with a slight acceleration to 2.2% in September(reversing <strong>the</strong> downward trend observed in2007) which levelled <strong>of</strong>f towards <strong>the</strong> end <strong>of</strong> <strong>the</strong>year as competition intensified in <strong>the</strong> context <strong>of</strong>a rapid fall in demand.Fur<strong>the</strong>r down <strong>the</strong> production chain, <strong>the</strong> sharpacceleration in consumer goods prices observedin <strong>the</strong> last few months <strong>of</strong> 2007 continued in <strong>the</strong>first half <strong>of</strong> <strong>2008</strong>. The annual rate <strong>of</strong> change inoverall consumer goods prices rose to 4.7% inMarch <strong>2008</strong>, <strong>the</strong> highest rate since <strong>the</strong> beginning<strong>of</strong> Monetary Union in 1999, mainly driven bynon-durable consumer goods prices, whichreflected global food price pressures. Excludingtobacco and food prices, <strong>the</strong> annual rate <strong>of</strong>change in consumer goods prices remained flatthroughout <strong>the</strong> year.Chart 25 Breakdown <strong>of</strong> industrial producerprices(annual percentage changes; monthly data)2824201612840-4energy (left-hand scale)industry excluding construction (right-hand scale)intermediate goods (right-hand scale)capital goods (right-hand scale)consumer goods (right-hand scale)2003 2004 2005 2006 2007Source: Eurostat.Note: Data refer to <strong>the</strong> euro area including Slovakia.<strong>2008</strong>Overall, by <strong>the</strong> end <strong>of</strong> <strong>the</strong> year, <strong>the</strong> generalweakening in euro area demand had resultedin considerably more competitive marketconditions at various stages <strong>of</strong> production. Thismore competitive environment, combined withfalling world commodity prices, was reflectedin widespread reports <strong>of</strong> price falls (or pricestabilisation), in input as well as output prices,for both manufacturing and services.LABOUR COSTS ACCELERATED MARKEDLYAvailable labour cost indicators for <strong>the</strong> euro areasuggest a substantial acceleration around <strong>the</strong> end<strong>of</strong> 2007 and <strong>the</strong> beginning <strong>of</strong> <strong>2008</strong>, followingyears <strong>of</strong> wage moderation. The average annualgrowth rate <strong>of</strong> compensation per employee in<strong>the</strong> first three quarters <strong>of</strong> <strong>the</strong> year was 3.3%,notably higher than <strong>the</strong> average annual growthrates recorded in <strong>the</strong> period 2005-07, whichranged from 1.8% to 2.5% (see Table 2).Hourly compensation provides a similar picture,although <strong>the</strong> first quarter was affected by <strong>the</strong>early timing <strong>of</strong> Easter in <strong>2008</strong>, thus resulting ina spike in <strong>the</strong> series in that quarter. Negotiatedwages also accelerated in <strong>the</strong> course <strong>of</strong> <strong>2008</strong>from <strong>the</strong> band <strong>of</strong> between 2.1% and 2.3% within14121086420-2ECBAnnual Report<strong>2008</strong>59

![KNOW YOUR NEW GIBRALTAR BANKNOTES - [Home] bThe/b](https://img.yumpu.com/50890985/1/184x260/know-your-new-gibraltar-banknotes-home-bthe-b.jpg?quality=85)
![PAPUA NEW GUINEA - [Home] - Polymer Bank Notes of the World](https://img.yumpu.com/49758743/1/190x143/papua-new-guinea-home-polymer-bank-notes-of-the-world.jpg?quality=85)