ANNUAL REPORT 2008 - Polymer Bank Notes of the World
ANNUAL REPORT 2008 - Polymer Bank Notes of the World
ANNUAL REPORT 2008 - Polymer Bank Notes of the World

You also want an ePaper? Increase the reach of your titles
YUMPU automatically turns print PDFs into web optimized ePapers that Google loves.
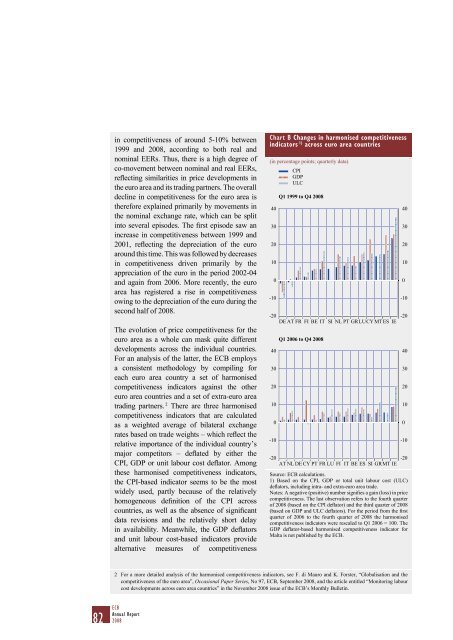
in competitiveness <strong>of</strong> around 5-10% between1999 and <strong>2008</strong>, according to both real andnominal EERs. Thus, <strong>the</strong>re is a high degree <strong>of</strong>co-movement between nominal and real EERs,reflecting similarities in price developments in<strong>the</strong> euro area and its trading partners. The overalldecline in competitiveness for <strong>the</strong> euro area is<strong>the</strong>refore explained primarily by movements in<strong>the</strong> nominal exchange rate, which can be splitinto several episodes. The first episode saw anincrease in competitiveness between 1999 and2001, reflecting <strong>the</strong> depreciation <strong>of</strong> <strong>the</strong> euroaround this time. This was followed by decreasesin competitiveness driven primarily by <strong>the</strong>appreciation <strong>of</strong> <strong>the</strong> euro in <strong>the</strong> period 2002-04and again from 2006. More recently, <strong>the</strong> euroarea has registered a rise in competitivenessowing to <strong>the</strong> depreciation <strong>of</strong> <strong>the</strong> euro during <strong>the</strong>second half <strong>of</strong> <strong>2008</strong>.The evolution <strong>of</strong> price competitiveness for <strong>the</strong>euro area as a whole can mask quite differentdevelopments across <strong>the</strong> individual countries.For an analysis <strong>of</strong> <strong>the</strong> latter, <strong>the</strong> ECB employsa consistent methodology by compiling foreach euro area country a set <strong>of</strong> harmonisedcompetitiveness indicators against <strong>the</strong> o<strong>the</strong>reuro area countries and a set <strong>of</strong> extra-euro areatrading partners. 2 There are three harmonisedcompetitiveness indicators that are calculatedas a weighted average <strong>of</strong> bilateral exchangerates based on trade weights – which reflect <strong>the</strong>relative importance <strong>of</strong> <strong>the</strong> individual country’smajor competitors – deflated by ei<strong>the</strong>r <strong>the</strong>CPI, GDP or unit labour cost deflator. Among<strong>the</strong>se harmonised competitiveness indicators,<strong>the</strong> CPI-based indicator seems to be <strong>the</strong> mostwidely used, partly because <strong>of</strong> <strong>the</strong> relativelyhomogeneous definition <strong>of</strong> <strong>the</strong> CPI acrosscountries, as well as <strong>the</strong> absence <strong>of</strong> significantdata revisions and <strong>the</strong> relatively short delayin availability. Meanwhile, <strong>the</strong> GDP deflatorsand unit labour cost-based indicators providealternative measures <strong>of</strong> competitivenessChart B Changes in harmonised competitivenessindicators 1) across euro area countries(in percentage points; quarterly data)403020100-10CPIGDPULCQ1 1999 to Q4 <strong>2008</strong>-20-20DE AT FR FI BE IT SI NL PT GRLUCY MT ES IE403020100-10Q1 2006 to Q4 <strong>2008</strong>-20-20AT NL DE CY PT FR LU FI IT BE ES SI GRMT IESource: ECB calculations.1) Based on <strong>the</strong> CPI, GDP or total unit labour cost (ULC)deflators, including intra- and extra-euro area trade.<strong>Notes</strong>: A negative (positive) number signifies a gain (loss) in pricecompetitiveness. The last observation refers to <strong>the</strong> fourth quarter<strong>of</strong> <strong>2008</strong> (based on <strong>the</strong> CPI deflator) and <strong>the</strong> third quarter <strong>of</strong> <strong>2008</strong>(based on GDP and ULC deflators). For <strong>the</strong> period from <strong>the</strong> firstquarter <strong>of</strong> 2006 to <strong>the</strong> fourth quarter <strong>of</strong> <strong>2008</strong> <strong>the</strong> harmonisedcompetitiveness indicators were rescaled to Q1 2006 = 100. TheGDP deflator-based harmonised competitiveness indicator forMalta is not published by <strong>the</strong> ECB.403020100-10403020100-102 For a more detailed analysis <strong>of</strong> <strong>the</strong> harmonised competitiveness indicators, see F. di Mauro and K. Forster, “Globalisation and <strong>the</strong>competitiveness <strong>of</strong> <strong>the</strong> euro area”, Occasional Paper Series, No 97, ECB, September <strong>2008</strong>, and <strong>the</strong> article entitled “Monitoring labourcost developments across euro area countries” in <strong>the</strong> November <strong>2008</strong> issue <strong>of</strong> <strong>the</strong> ECB’s Monthly Bulletin.82 ECBAnnual Report<strong>2008</strong>
![KNOW YOUR NEW GIBRALTAR BANKNOTES - [Home] bThe/b](https://img.yumpu.com/50890985/1/184x260/know-your-new-gibraltar-banknotes-home-bthe-b.jpg?quality=85)
![PAPUA NEW GUINEA - [Home] - Polymer Bank Notes of the World](https://img.yumpu.com/49758743/1/190x143/papua-new-guinea-home-polymer-bank-notes-of-the-world.jpg?quality=85)