- Page 1 and 2: ®Integrator /CPCompact Platform Ba
- Page 3 and 4: Conformance NoticesThis section con
- Page 5 and 6: ContentsIntegrator/CP User GuidePre
- Page 7 and 8: PrefaceThis preface introduces the
- Page 9 and 10: PrefaceTypographical conventionsThe
- Page 11 and 12: Preface• MultiMedia Card Product
- Page 13 and 14: Chapter 1IntroductionThis chapter i
- Page 15 and 16: IntroductionCore moduleBaseboardFig
- Page 17 and 18: Introduction1.2.2 System connectors
- Page 19 and 20: IntroductionCore module connectorsF
- Page 21 and 22: IntroductionLED Color FunctionTable
- Page 23 and 24: Introduction1.3.3 Care of connector
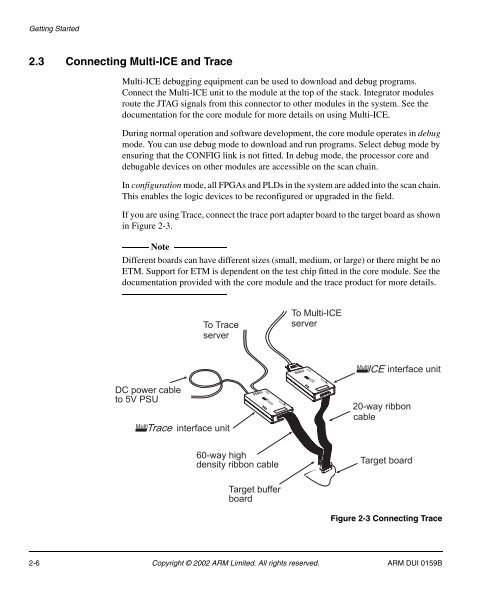
- Page 25 and 26: Chapter 2Getting StartedThis sectio
- Page 27 and 28: Getting Started2.1 Setting the DIP
- Page 29: Getting StartedTable 2-2 shows the
- Page 34 and 35: Getting Started2.5.2 Possible effec
- Page 36 and 37: Getting Started2.5.5 System informa
- Page 38 and 39: System Architecture3.1 About the sy
- Page 40 and 41: System ArchitectureNoteTable B-1 on
- Page 42 and 43: System Architecture3.3 Module-assig
- Page 44 and 45: System ArchitectureCFGSEL0CFGSEL1HI
- Page 46 and 47: System ArchitectureThe APB is an AM
- Page 48 and 49: System ArchitectureNoteThe copies o
- Page 50 and 51: System Architecture3.6 Interrupt co
- Page 52 and 53: System ArchitectureAn example of th
- Page 54 and 55: System ArchitectureThe secondary co
- Page 56 and 57: System ArchitectureNoteThe constant
- Page 58 and 59: System ArchitecturenFIQ3 nFIQ0 nFIQ
- Page 60 and 61: System Architecture3.8 Configuring
- Page 62 and 63: System ArchitecturePeripheral Addre
- Page 64 and 65: System ArchitectureCP_FLASHPROGThe
- Page 66 and 67: System ArchitectureCP_DECODEBits 7
- Page 68 and 69: Peripherals and Interfaces4.1 GPIO
- Page 70 and 71: Peripherals and Interfaces4.2 Ether
- Page 72 and 73: Peripherals and Interfaces4.3 Displ
- Page 74 and 75: Peripherals and InterfacesLCD1_BIAS
- Page 76 and 77: Peripherals and InterfacesThe timin
- Page 78 and 79: Peripherals and InterfacesFor VGA o
- Page 80 and 81:
Peripherals and Interfaces4.4 Touch
- Page 82 and 83:
Peripherals and InterfacesTouchscre
- Page 84 and 85:
Peripherals and InterfacesTable 4-9
- Page 86 and 87:
Peripherals and Interfaces4.5 Audio
- Page 88 and 89:
Peripherals and InterfacesPRESETnPW
- Page 90 and 91:
Peripherals and InterfacesWhen the
- Page 92 and 93:
Peripherals and InterfacesTable 4-1
- Page 94 and 95:
Peripherals and InterfacesTable 4-1
- Page 96 and 97:
Peripherals and Interfaces4.6.2 Pri
- Page 98 and 99:
Peripherals and InterfacesTable 4-1
- Page 100 and 101:
Peripherals and Interfaces4.7.2 KMI
- Page 102 and 103:
Peripherals and InterfacesTable 4-1
- Page 104 and 105:
Peripherals and Interfaces4.8.2 UAR
- Page 106 and 107:
Peripherals and Interfaces4.8.5 Ove
- Page 108 and 109:
Peripherals and Interfaces4.9 Count
- Page 110 and 111:
Peripherals and InterfacesTable 4-1
- Page 112 and 113:
Peripherals and InterfacesTable 4-1
- Page 114 and 115:
Peripherals and Interfaces4.10 Debu
- Page 116 and 117:
Peripherals and InterfacesTable 4-2
- Page 118 and 119:
Peripherals and Interfaces4-52 Copy
- Page 120 and 121:
System Expansion5.1 Expanding your
- Page 122 and 123:
System Expansion5-4 Copyright © 20
- Page 124 and 125:
Porting Integrator/AP and IM-PD1A.1
- Page 126 and 127:
Porting Integrator/AP and IM-PD1A.3
- Page 128 and 129:
Connector PinoutsB.1 Header connect
- Page 130 and 131:
Connector PinoutsB.1.2Baseboard con
- Page 132 and 133:
Connector PinoutsTable B-2 HDRB sig
- Page 134 and 135:
Connector Pinouts465321Figure B-4 K
- Page 136 and 137:
Connector PinoutsTable B-5 Generic
- Page 138 and 139:
Connector Pinouts1 2 3 4 56 7 8 9 1
- Page 140 and 141:
Connector PinoutsTable B-9 Touchscr
- Page 142 and 143:
Connector PinoutsB.2.6Ethernet debu
- Page 144 and 145:
Connector PinoutsLEDDATA_BUF12GNDnL
- Page 146 and 147:
Connector PinoutsMCI_112GNDMCI_2GND
- Page 148 and 149:
Connector PinoutsB-22 Copyright ©
- Page 150 and 151:
1 2 3 4OFFTest PointsC.1 Baseboard
- Page 152 and 153:
Test PointsC-4 Copyright © 2002 AR
- Page 154 and 155:
GlossaryDTEETMFIFOFPGAGPIOJTAGKMILC
- Page 156 and 157:
Indexregister bit assignments 3-16F
- Page 158:
IndexIndex-4 Copyright © 2002 ARM