- Page 3 and 4:
FiguresFigure 2.1 - Youth Gang Crim
- Page 5:
Table 10.12 - Best Model Predicting
- Page 8 and 9:
Arrests, Youth With and Without “
- Page 10 and 11:
...................................
- Page 12 and 13:
Chapter 1Introduction and Review of
- Page 14 and 15:
Gang problems have radically increa
- Page 16 and 17:
for youth with school officials if
- Page 18 and 19:
various agencies sponsoring the you
- Page 20 and 21:
the specialized youth-gang projects
- Page 22 and 23:
ehavior of the youngsters residing
- Page 24 and 25:
work” (manpower training and job
- Page 26 and 27:
(separately from the efforts of TWO
- Page 28 and 29:
impact of CIN was not conducted (Cr
- Page 30 and 31:
procedures that have often been an
- Page 32 and 33:
developed programs to address the g
- Page 34 and 35:
members, representing 56 agencies i
- Page 36 and 37:
Grasmick (1993) recommend “the re
- Page 38 and 39:
and expulsion practices in dealing
- Page 40 and 41:
membership, school, job, and commun
- Page 42 and 43:
Assessment, planning and evaluation
- Page 44 and 45:
Human Services (DHS) was terminatin
- Page 46 and 47:
IVProgram StrategyThe strategy to a
- Page 48 and 49:
Community Advisory GroupA group of
- Page 50 and 51:
policies and procedures which affec
- Page 52 and 53:
component. The expectation was that
- Page 54 and 55:
social opportunities and mobilize c
- Page 56 and 57:
collective involvement of police, c
- Page 58 and 59:
Figure 2.1Youth Gang Crime: A Theor
- Page 60 and 61:
assistant to Alderman Guttierez, wh
- Page 62 and 63:
involved in the Project and believe
- Page 64 and 65:
pattern of communication between wo
- Page 66 and 67:
mainly in the late afternoon, night
- Page 68 and 69:
him.November 12, 7:00 PM. The 16-ye
- Page 70 and 71:
station intimidating local citizens
- Page 72 and 73:
Developing the Roles and Responsibi
- Page 74 and 75:
on individual contact with gang you
- Page 76 and 77:
individual youth. The completion of
- Page 78 and 79:
tactical officers were assigned ful
- Page 80 and 81:
disrespecting” the gang members.
- Page 82 and 83:
Probation would be contributing thr
- Page 84 and 85:
Department: “it appears criticall
- Page 86 and 87:
payment to Center staff for mainten
- Page 88 and 89:
Neighborhood Organization (UNO), th
- Page 90 and 91:
survey. The request was possibly re
- Page 92 and 93:
Gang Member Survey served both prog
- Page 94 and 95:
ideologies as they interacted and w
- Page 96 and 97:
their probation officers at probati
- Page 98 and 99:
peripheral, or associate gang membe
- Page 100 and 101:
This statement puzzled the rest of
- Page 102 and 103:
the development of the Project were
- Page 104 and 105:
from outside the community who inva
- Page 106 and 107:
not all activities or operations of
- Page 108 and 109:
Interrelated activity by Project pe
- Page 110 and 111:
with the same youth, then disagreed
- Page 112 and 113:
the father, in a federal penitentia
- Page 114 and 115:
gangs were to be provided outreach
- Page 116 and 117:
target youth to disassociate themse
- Page 118 and 119:
where the youth and gangs to which
- Page 120 and 121:
educational background or ability t
- Page 122 and 123:
areas. They were able to inconspicu
- Page 124 and 125:
out across racial or ethnic groups
- Page 126 and 127:
marched into the Two Six territory
- Page 128 and 129:
school to gain readmission to a reg
- Page 130 and 131:
would have to travel through enemy
- Page 132 and 133:
e more successful in the process of
- Page 134 and 135:
other youth.The youth work Supervis
- Page 136 and 137:
members, permitting the youth to st
- Page 138 and 139:
problems arose that affected the ne
- Page 140 and 141:
attles, or to take care of gang mem
- Page 142 and 143:
Project, wrote in one of his record
- Page 144 and 145:
officers of the violent crime unit
- Page 146 and 147:
Rolando, a former leader of a facti
- Page 148 and 149:
1. not give undue publicity to part
- Page 150 and 151:
double homicide. Manuel had grown u
- Page 152 and 153:
These expectations were not always
- Page 154 and 155:
not wearing a shirt. His old gang t
- Page 156 and 157:
former gang members, in a team arra
- Page 158 and 159:
the tactical officers. The adult pr
- Page 160 and 161:
field operations were expected to s
- Page 162 and 163:
expected to help probation respond
- Page 164 and 165:
Chicago Police Department. A key pr
- Page 166 and 167:
the CPD as the senior partner) in t
- Page 168 and 169:
past and present history of all Pro
- Page 170 and 171:
gangs as part of their police tacti
- Page 172 and 173:
say we’re just talking to these g
- Page 174 and 175:
R.C.We call the detectives to see i
- Page 176 and 177:
I.S.What are you doing that’s dif
- Page 178 and 179:
G.S.We locked this one guy up. He w
- Page 180 and 181:
indirectly at first where to go. It
- Page 182 and 183:
“a real good kid. This is the fir
- Page 184 and 185:
G.S.That’s part of the problem, y
- Page 186 and 187:
R.C.He’s not active in the gang,
- Page 188 and 189:
family, helping the worker get to a
- Page 190 and 191:
G.S.As we said before, before you g
- Page 192 and 193:
Chapter 7Community MobilizationIntr
- Page 194 and 195:
organizational processes which affe
- Page 196 and 197:
consistently made it clear that his
- Page 198 and 199:
do approach of the CPD. Citizen inv
- Page 200 and 201:
youth were also part of an illegal
- Page 202 and 203:
seeking applicants for jobs in boom
- Page 204 and 205:
part of the community.There appeare
- Page 206 and 207:
epresentatives of the Chicago Parks
- Page 208 and 209:
problem, especially as it affected
- Page 210 and 211:
In the application for funding to t
- Page 212 and 213:
with the African-American gang prob
- Page 214 and 215:
purpose of the meetings was to rais
- Page 216 and 217:
interagency meeting, which was fina
- Page 218 and 219:
provided to the state funding agenc
- Page 220 and 221:
activity, especially violence and g
- Page 222 and 223:
expelling more gang members than ev
- Page 224 and 225:
Chapter 8Characteristics of Program
- Page 226 and 227:
youth who entered the program in ov
- Page 228 and 229:
expectations, peer relationships, a
- Page 230 and 231:
To determine the representativeness
- Page 232 and 233:
neighborhood characteristics, as we
- Page 234 and 235:
was evidence, however, that some of
- Page 236 and 237:
legal sources; at Time II it was 71
- Page 238 and 239:
ehavior and arrests when we later e
- Page 240 and 241:
cultural institutions (e.g., povert
- Page 242 and 243:
prone to attacking the Latin Kings
- Page 244 and 245:
changed, and to what extent the red
- Page 246 and 247:
52.0% to 70.0% of the interview sam
- Page 248 and 249:
aspired to clerical, trade, and fac
- Page 250 and 251:
positive at Time I and Time III, bu
- Page 252 and 253:
in Little Village, who were gang me
- Page 254 and 255:
involved and violent youth and assi
- Page 256 and 257:
inaccuracies and inconsistencies in
- Page 258 and 259:
we excluded the twelve youth over 2
- Page 260 and 261:
(30.4%) and the comparison group (1
- Page 262 and 263:
violence which includes, in additio
- Page 264 and 265:
Chapter 9Program-Worker Contacts, S
- Page 266 and 267:
easons, failed to provide tracking
- Page 268 and 269:
Project police officers served or c
- Page 270 and 271:
in contact with a youth 13 times pe
- Page 272 and 273:
We describe the proportion of diffe
- Page 274 and 275:
younger youth) were provided with s
- Page 276 and 277:
involved in job-related contacts wi
- Page 278 and 279:
Youth Response to the ProjectFinall
- Page 280 and 281:
members of the two targeted gangs i
- Page 282 and 283:
individual youth in a group context
- Page 284 and 285:
Job-Related Services, the primary o
- Page 286 and 287:
Aggregating Types of Services (Acti
- Page 288 and 289:
workers. Of interest are the gang s
- Page 290 and 291:
proportion of younger or older gang
- Page 292 and 293:
Table 9.2Types of Services (Activit
- Page 294 and 295:
Table 9.4Type of Service (Activity)
- Page 296 and 297:
Table 9.6Job-Related Services, by T
- Page 298 and 299:
Table 9.8Criminal-Justice-Related S
- Page 300 and 301: Table 9.10Aggregated Types of Perso
- Page 302 and 303: Table 9.12Project Strategies, by Yo
- Page 304 and 305: Table 9.14Services (Activities), by
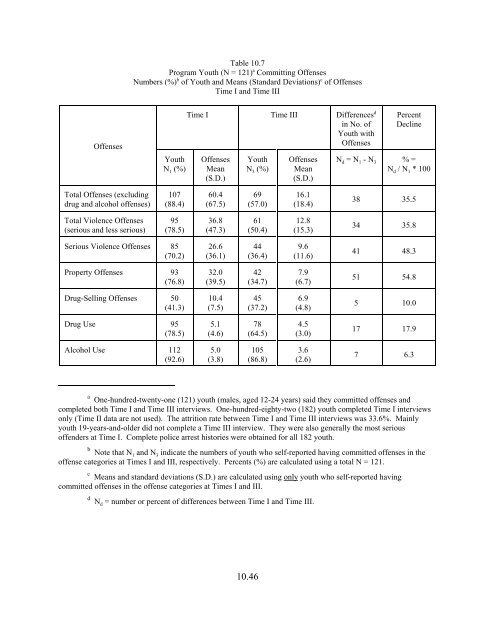
- Page 306 and 307: Chapter 10Self-Reported Offense, Ar
- Page 308 and 309: 7) breaking into a car and stealing
- Page 310 and 311: Similar sharp declines in frequenci
- Page 312 and 313: also in our analysis using official
- Page 314 and 315: offense and arrest categories betwe
- Page 316 and 317: (-48.3%). The least decline was for
- Page 318 and 319: a crime in the community. All of th
- Page 320 and 321: suppression effect, particularly at
- Page 322 and 323: present at Time III. There are no s
- Page 324 and 325: violence arrests and serious violen
- Page 326 and 327: with offending behavior. In the res
- Page 328 and 329: 0.001), drug selling (r = 0.259, p
- Page 330 and 331: Finally, we began to test the utili
- Page 332 and 333: employment status (1= currently emp
- Page 334 and 335: includes six variables: one control
- Page 336 and 337: significance are: youth over 19 yea
- Page 338 and 339: Our best model for predicting chang
- Page 340 and 341: All of these reductions were highly
- Page 342 and 343: it in the future; and the higher th
- Page 344 and 345: The above models suggest that a var
- Page 346 and 347: Table 10.2Mean Frequencies of Self-
- Page 348 and 349: Offenses/Arrests bTable 10.4Mean Fr
- Page 352 and 353: Table 10.8Self-Reported Offenses -
- Page 354 and 355: Table 10.10Best Model Predicting Se
- Page 356 and 357: Table 10.12Best Model Predicting Se
- Page 358 and 359: Table 10.14Best Model Predicting Ch
- Page 360 and 361: decreased or remained the same betw
- Page 362 and 363: the types and scope of arrests, and
- Page 364 and 365: Program-Period Arrest PatternsThe f
- Page 366 and 367: p = 0.039. This model explains 43.6
- Page 368 and 369: violence at Time I increases its ar
- Page 370 and 371: Model IV: Property ArrestsThe same
- Page 372 and 373: The drug-change model was construct
- Page 374 and 375: Our analysis procedure is the same
- Page 376 and 377: types of arrests, comparing Time I
- Page 378 and 379: were at Time II, at least for relat
- Page 380 and 381: Figure 11.1Distribution of Youth in
- Page 382 and 383: Four Levels of Arrests for theThree
- Page 384 and 385: 11.3(c) Adjusted Mean Change in Tot
- Page 386 and 387: 11.4(c) Adjusted Mean Change in Ser
- Page 388 and 389: Table 11.5An Analysis of Variance o
- Page 390 and 391: 11.5(f) Adjusted Mean Change in Tot
- Page 392 and 393: 11.6(c) Adjusted Mean Change in Pro
- Page 394 and 395: 11.7(c) Adjusted Mean Change in Dru
- Page 396 and 397: Table 11.8An Analysis of Variance o
- Page 398 and 399: 11.8(f) Adjusted Mean Change in Oth
- Page 400 and 401:
11.9(c) Adjusted Mean Change in Spe
- Page 402 and 403:
Chapter 12Modeling Program Effects:
- Page 404 and 405:
variables. We used the number of an
- Page 406 and 407:
when the outcome variable was chang
- Page 408 and 409:
delinquency patterns over the progr
- Page 410 and 411:
and self-reported-offense variables
- Page 412 and 413:
Again, most variables are derived f
- Page 414 and 415:
(p = 0.032), but a positive relatio
- Page 416 and 417:
We try to identify those specific c
- Page 418 and 419:
likelihood of more youth spending l
- Page 420 and 421:
outcome, using police arrest data f
- Page 422 and 423:
Table 12.1Pre-Program a Arrest Patt
- Page 424 and 425:
Table 12.3Best Model Predicting Cha
- Page 426 and 427:
Table 12.5Best Model Predicting Cha
- Page 428 and 429:
12.6.B-1 Job Referral Success by Wo
- Page 430 and 431:
12.6.E-1 Length of Service Contact
- Page 432 and 433:
Chapter 13Typology of Gang YouthFor
- Page 434 and 435:
markets, resulting in high levels o
- Page 436 and 437:
individual gang youth in our Little
- Page 438 and 439:
“other” crimes. Nevertheless, f
- Page 440 and 441:
type of youth-arrestee subsample, i
- Page 442 and 443:
and a greater increase or “specia
- Page 444 and 445:
these youth were represented in the
- Page 446 and 447:
number of offenses at Time I, but a
- Page 448 and 449:
Total Arrests. In the model with th
- Page 450 and 451:
The 19-and-over program sample also
- Page 452 and 453:
We find similar and proportionate d
- Page 454 and 455:
Table 13.2Yearly Arrests of Youth i
- Page 456 and 457:
Table 13.3 continuedFootnotesaArres
- Page 458 and 459:
13.4(c) Adjusted Mean Yearly Total
- Page 460 and 461:
13.4(f) Adjusted Mean Yearly Total
- Page 462 and 463:
13.5(c) Adjusted Mean Yearly Seriou
- Page 464 and 465:
Table 13.6Analysis of Variance of C
- Page 466 and 467:
13.6(e) Adjusted Mean Yearly Total
- Page 468 and 469:
13.7(c) Adjusted Mean Yearly Drug A
- Page 470 and 471:
Table 13.8Analysis of Variance of C
- Page 472 and 473:
13.8(e) Adjusted Mean Yearly Other
- Page 474 and 475:
Chapter 14The Effectiveness of the
- Page 476 and 477:
of the specific types of services p
- Page 478 and 479:
The success rate was relatively hig
- Page 480 and 481:
in respect to the outcome or depend
- Page 482 and 483:
(odds ratio = 3.31) and the Latin K
- Page 484 and 485:
violent behavior, was associated wi
- Page 486 and 487:
drug arrests, in a model together w
- Page 488 and 489:
SummaryIn general, “very effectiv
- Page 490 and 491:
than do non-services contacts. The
- Page 492 and 493:
per youth, and the perceptions by t
- Page 494 and 495:
educing violence arrests, and viole
- Page 496 and 497:
assume, because of small size, that
- Page 498 and 499:
program subsample (39.1%). Also, th
- Page 500 and 501:
patterns, in particular types or co
- Page 502 and 503:
Table 14.1Summary of Logistic Regre
- Page 504 and 505:
Table 14.3Summary of Logistic Regre
- Page 506 and 507:
Table 14.5Summary of Logistic Regre
- Page 508 and 509:
Table 14.7Summary of Logistic Regre
- Page 510 and 511:
Table 14.9Summary of Logistic Regre
- Page 512 and 513:
Table 14.11Summary of Logistic Regr
- Page 514 and 515:
Table 14.13Summary of Logistic Regr
- Page 516 and 517:
Table 14.15Summary of Logistic Regr
- Page 518 and 519:
Table 14.17Summary of Logistic Regr
- Page 520 and 521:
Table 14.19Comparison of Odds Ratio
- Page 522 and 523:
Table 14.21Most Serious Sentencing
- Page 524 and 525:
Table 14.23Arrestee Typology of You
- Page 526 and 527:
Chapter 15Aggregate-Level Changes I
- Page 528 and 529:
Comparable Police Districts and Bea
- Page 530 and 531:
and aggravated assaults with a hand
- Page 532 and 533:
Section I[Refer to Tables 15.1 to 1
- Page 534 and 535:
It is also important to note that l
- Page 536 and 537:
target gangs during the last two ye
- Page 538 and 539:
than the average percentage increas
- Page 540 and 541:
number of offenders in the District
- Page 542 and 543:
involved in drug arrests. Again, a
- Page 544 and 545:
accounted for only a small increase
- Page 546 and 547:
Table 15.1 aGang Incident Data - Vi
- Page 548 and 549:
Table 15.3 aGang Incident Data - To
- Page 550 and 551:
Table 15.5 aGang Incident Data - Dr
- Page 552 and 553:
Table 15.7 aGang Offender Data - Vi
- Page 554 and 555:
Table 15.9 aGang Offender Data - Vi
- Page 556 and 557:
Table 15.11 aGang Offender Data - V
- Page 558 and 559:
Table 15.13 aGang Offender Data - L
- Page 560 and 561:
Table 15.15 aGang Offender Data - A
- Page 562 and 563:
Table 15.17 aGang Offender Data - A
- Page 564 and 565:
Table 15.19 aGang Offender Data - W
- Page 566 and 567:
Table 15.21 aGang Offender Data - D
- Page 568 and 569:
Table 15.23 aGang Offender Data - D
- Page 570 and 571:
Table 15.25 aGang Offender Data - F
- Page 572 and 573:
Table 15.27 aNon-Gang Incidents - V
- Page 574 and 575:
years of its existence than in the
- Page 576 and 577:
crime is best sustained during both
- Page 578 and 579:
Figure 15.1AComparison of Average Y
- Page 580 and 581:
Figure 15.3ATen-Year Trend of Gang
- Page 582 and 583:
Figure 15.1BComparison of Average Y
- Page 584 and 585:
Figure 15.3BSix-Year Trend of Gang
- Page 586 and 587:
the gang problem (i.e., number of s
- Page 588 and 589:
Section IVwith Rolando V. SosaIncid
- Page 590 and 591:
SummaryThe aggregate patterns of ch
- Page 592 and 593:
Village the serious gang violence r
- Page 594 and 595:
cultural, and health institutions s
- Page 596 and 597:
II. While every attempt was made to
- Page 598 and 599:
worse had dropped by almost half be
- Page 600 and 601:
few respondents in either community
- Page 602 and 603:
Pilsen). These declines between tim
- Page 604 and 605:
I (n = 94) to 20.0% at Time II (n =
- Page 606 and 607:
(Chisquare = 4.723, df = 1, p # 0.0
- Page 608 and 609:
territory), there was no longer a s
- Page 610 and 611:
increase in Little Village can be a
- Page 612 and 613:
Time I and Time II. Slightly more o
- Page 614 and 615:
can be associated with the GVRP (pa
- Page 616 and 617:
Pilsen respondents did. Pilsen repr
- Page 618 and 619:
and from 84.5% to 67.3% in Pilsen (
- Page 620 and 621:
educe the presence of gangs in the
- Page 622 and 623:
followed by improved schools, incre
- Page 624 and 625:
particular, were less afraid in the
- Page 626 and 627:
Table 16.1Community Characteristics
- Page 628 and 629:
Table 16.3Problems in the Community
- Page 630 and 631:
Table 16.5Gang-Motivated and Non Ga
- Page 632 and 633:
Table 16.7What Police Do to Deal wi
- Page 634 and 635:
Table 16.9Amount of Gang-Motivated
- Page 636 and 637:
Table 16.11What Police Do to Deal w
- Page 638 and 639:
Table 16.13Organizations Believe Co
- Page 640 and 641:
Table 16.15Amount of Gang-Motivated
- Page 642 and 643:
Table 16.17What Probation Officers
- Page 644 and 645:
he quickly assumed coordination and
- Page 646 and 647:
• Communication: Perhaps more imp
- Page 648 and 649:
to your proposal.”In a November 1
- Page 650 and 651:
foundations, and other sources. The
- Page 652 and 653:
knowledge or permission of the Coor
- Page 654 and 655:
although we expect to expand many e
- Page 656 and 657:
Project staff were notified of prog
- Page 658 and 659:
police, probation and youth workers
- Page 660 and 661:
ideological terms between 1992 and
- Page 662 and 663:
esponsibility of Project operations
- Page 664 and 665:
• Program features: The program h
- Page 666 and 667:
In a November 1996 monthly report,
- Page 668 and 669:
activities with adult probation. Th
- Page 670 and 671:
conflict with each other. MLG and t
- Page 672 and 673:
program might look like.We have ben
- Page 674 and 675:
arrangement was delayed and interru
- Page 676 and 677:
CPD and CCDAP probably did not clea
- Page 678 and 679:
18.18
- Page 680 and 681:
Carney, Frank J., Hans W. Mattick a
- Page 682 and 683:
Klein, Malcolm W. 1968 (July). The
- Page 684 and 685:
Short, James F., Jr, and Fred L. St
- Page 686:
Swans, Bennie J. 1981 (May 11). Cri